Event Diagram
About Event Diagram
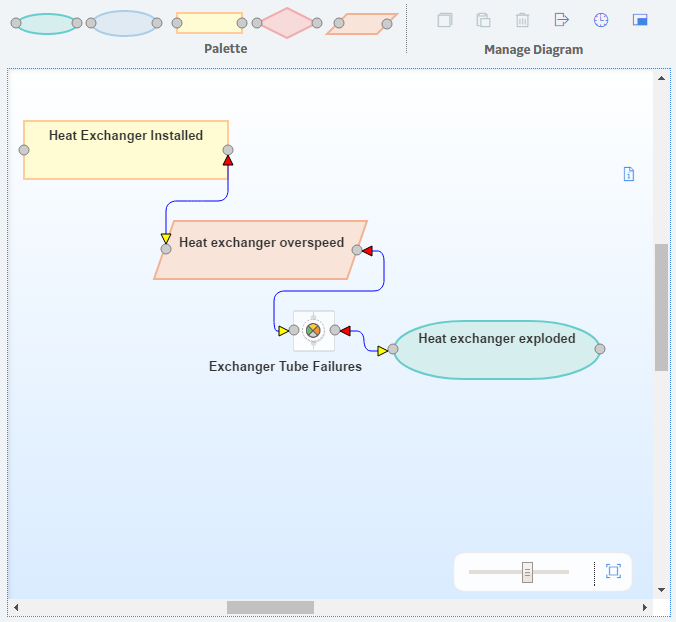
In an RCA, analyzing data involves compiling the information that has been collected so far in the Root Cause Analysis and representing it visually to facilitate discussion. An Event Diagram is an organizational tool that you can use to diagram a sequence of events, which are possible causes of a failure event.
The Event Diagram lets you represent visually the events that are associated with a failure and the cause-and-effect relationships that may have led to a failure event. The Event Diagram depicts how the events affect each other and enables you to identify possible work process issues. Each event is represented by a labeled icon, called a node. You can add nodes to the Failure Event node that represent components of the Root Cause Analysis. For example, if you define the Failure Event node as a fire, in the Event Diagram you can add to the Failure Event node upstream nodes that depict the chain of events that preceded the failure event.
The following list provides the types of nodes that you can use in an Event Diagram:
| Node Icon | Node Name | Can be used to represent... |
|---|---|---|

| Start/Finish | A step that marks the starting point or the ending point of the event. |

| References | A printed document or report. |

| Process | A single step or an entire sub-process within a larger process. |

| Decision | A decision or branching point. |

| Operation | Material or information entering or leaving the system, such as customer order (input) or a product (output). |
You can create connections between the nodes in the Event Diagram to establish a relationship between the nodes. Each node in the diagram canvas has two ports that are used for connecting nodes to another node. Each port is designated by a circle on the right and left of the node. You can initiate a connection only from right circle (output port) of the predecessor node to the left circle (input port) of the successor node. You can create as many connections as you need to build the Event Diagram. More than one connector can be attached to the same port of a node, allowing you to create parallel events. As you connect the nodes to build the Event Diagram, links are created between the items using a predecessor-successor relationship definition that exists between them.
About Failure Events
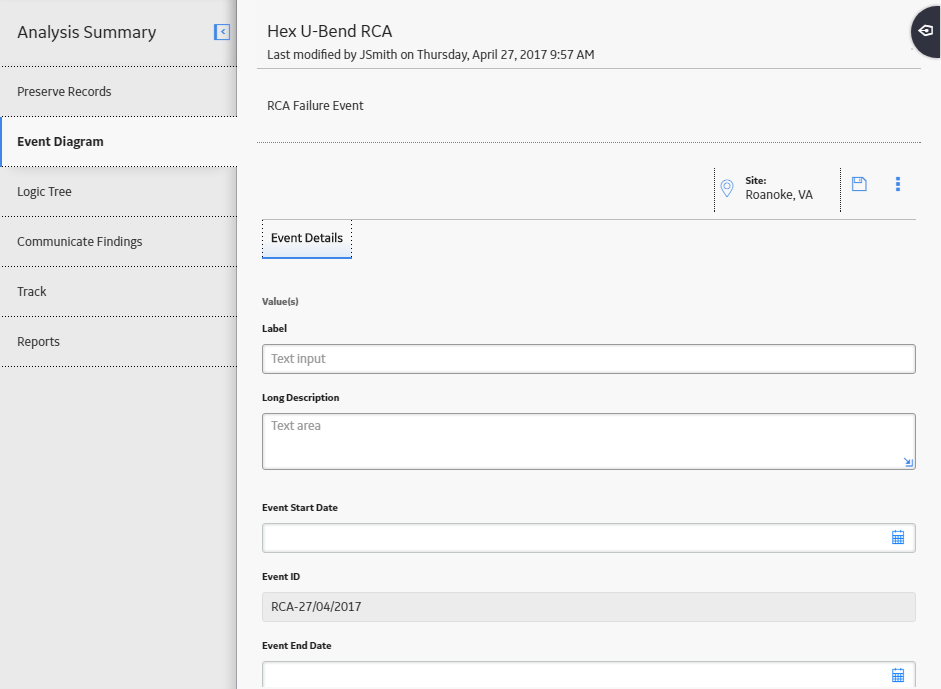
The failure event is a short description of the problem that you and your team are analyzing. Your team could be analyzing a failure event that comprises several failures over a specified period of time, or one failure (e.g., a larger event, such as a fire). The first time that you access the Event Diagram workspace or the Logic Tree workspace for a given RCA, you will be prompted to define the failure event in an RCA Event, which will be used as the Failure Event node. The following image shows an example of a completed RCA Event.
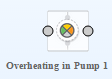
Each RCA will have one Failure Event node, which will always appear at the root level of the Logic Tree hierarchy and as the first node in the Event Diagram. For example, the following image shows the Failure Event node as it appears in the Logic Tree in our Cooling Water Pump example.
You cannot remove the Failure Event node from the Logic Tree or the Event Diagram. You can, however, modify the RCA Event, as needed.
Access an Event Diagram
Procedure
- In the left pane, select the Event Diagram tab.
The Event Diagram for the selected RCA appears in the workspace.
Tip:- Select
 to display the event dates.
 - Select
 to display the diagram in full screen.
Note: If you access the Event Diagram tab for the first time, the RCA Failure Event datasheet will appear in the workspace. In this datasheet, you can define an RCA Failure Event. If you previously accessed the Event Diagram tab and defined a Failure Event, you will see the Failure Event node in the main display area (i.e., the design canvas). - Select
Create a Failure Event
Procedure
- In the left pane, select the Event Diagram tab.
A blank datasheet appears.
- Select
 .
.The RCA Failure Event is created and linked automatically to the RCA. The Failure Event node appears in the design canvas.
What to do next
Add a Node to the Event Diagram
Before you begin
Procedure
- In the upper-right corner of the workspace, select
 .
.The Properties window appears, displaying the datasheet for the selected node.
- Select .
The node is saved and linked automatically to the selected RCA.
What to do next
Copy a Node
About this task
After you create nodes in your Event Diagram, you can copy and paste them within the same Event Diagram. You can copy an existing node or add a node to the Event Diagram from the Palette in the design canvas.
Procedure
- At the top of the workspace, in the Manage Diagram section, select
 , and then select
  .Note: The Paste option is available only after you have copied a node.
The node is pasted to the design canvas.
What to do next
Connect Nodes
Before you begin
Procedure
What to do next
Modify an Event Diagram Node
Procedure
- In the upper-right corner of the workspace, select .
The datasheet for the selected node appears in the Properties window.
- As needed, modify the available fields, and then select .
Your changes are saved to the database.
Access Reference Documents for a Failure Event Node
Procedure
- In the upper-right corner of the workspace, select .
The Properties window appears, displaying the datasheet for the selected Failure Event node.
- On the datasheet, select
 , and then select Reference Documents.
 A list of Reference Documents linked to the selected Failure Event node appears.
Note: For more information, refer to the Manage Reference Documents section of the documentation for additional options when working with reference documents.
Export an Event Diagram
About this task
You can export an Event Diagram as an image and save it to another location, such as your local hard drive.
Procedure
- In the upper portion of the workspace, in the Edit section, select
 .
. The Save as window appears.
Delete Nodes from the Event Diagram
About this task
When you delete a node from the Event Diagram, you are deleting the associated RCA Sequence Node and any links to the associated RCA Sequence Node.
Procedure
- At the top of the workspace, in the Edit section, select
 .
.The Delete Node dialog box appears, asking you to confirm that you want to delete the selected node.
Delete Node Connectors
Procedure
- On the design canvas, hover or tap on the connector that you want to delete.
The
 icon appears.
 - Select .
The connector is deleted from the Event Diagram. The GE Digital APM system also updates the links for each node when one or more connectors attached to the node are deleted.