Overview
Overview of the AMS Analytics Module
You can use the AMS Analytics module to view and analyze data that exists in an external AMS Analytics data source, which may include any of the following:
- AMS Suite: Intelligent Device Manager
- AMS Suite: Machinery Health Manager
- AMS Suite: Equipment Performance Monitor
- AMS Suite: Equipment Performance Advisor
Using AMS Analytics, you can transfer data from AMS Analytics data sources into the GE Digital APM database. When the data is transferred, records in the AMS Analytics data model are created automatically and populated with values from the data source.
All of the AMS Analytics data sources listed above are components of the AMS Suite and store information that is reported about AMS Assets, such as alerts and events, to provide an indication of their overall health. AMS Assets typically represent smart sensors that report events related to either the health of the asset (e.g. equipment or functional location) that the sensor is monitoring or the health of the sensor itself. By incorporating this information into your GE Digital APM implementation, you can use the tools in AMS Analytics to assess the overall health of sensors and the related assets in your facility.
You can use AMS Analytics to:
- View the data using queries, graphs, and reports.
- Determine the overall health of the assets and sensors in your facility.
- Identify problematic assets and sensors.
- Create AMS Asset Recommendation records.
- Generate work requests or notifications in an EAM system.
AMS Analytics Workflow
This workflow provides the basic, high-level steps for using this module.
-
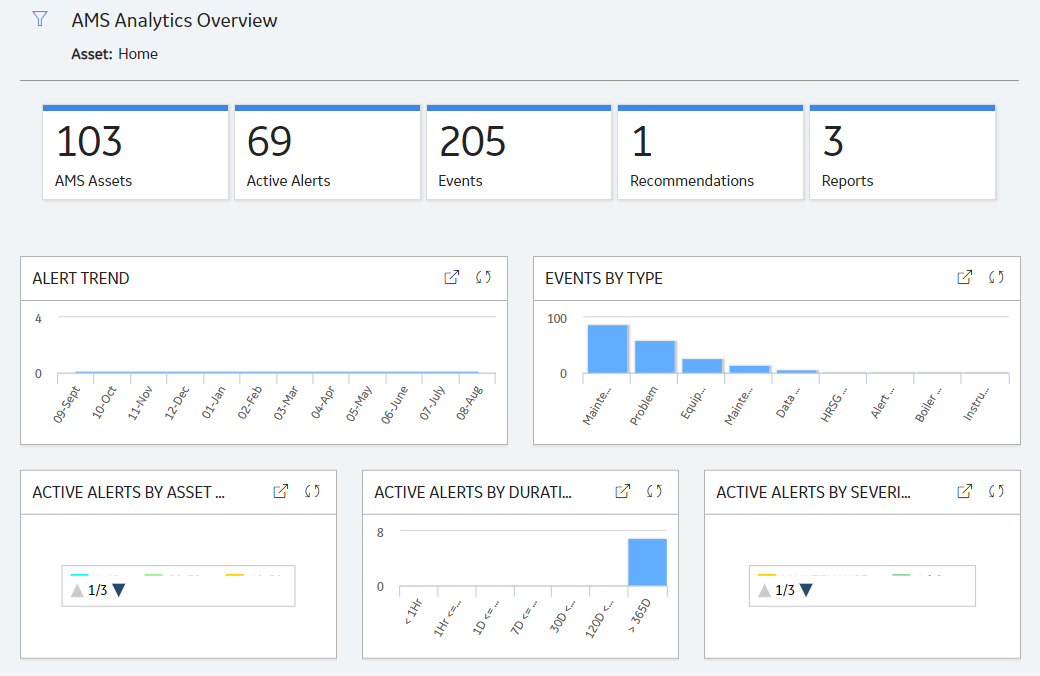
Review the queries, graphs, and reports available on the AMS Analytics Overview page.
-
In Asset Health Manager, view the AMS Asset Alerts or Events in context with other asset health information including health indicators and policy results.
-
As necessary, create recommendations based on AMS Asset Alerts or Events.
Access the AMS Analytics Overview Page
Procedure
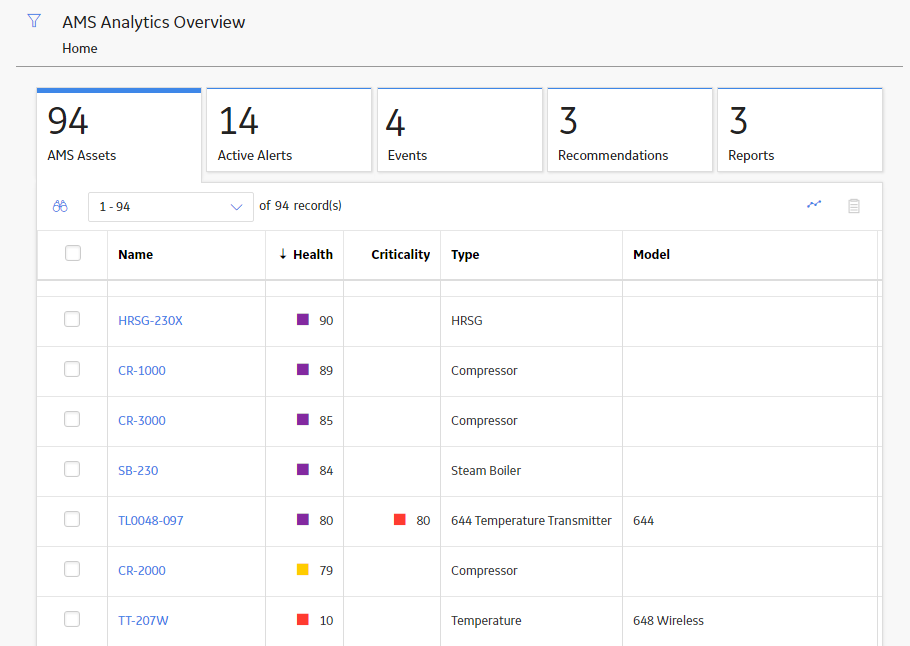
- AMS Assets: Contains a table of AMS Assets.
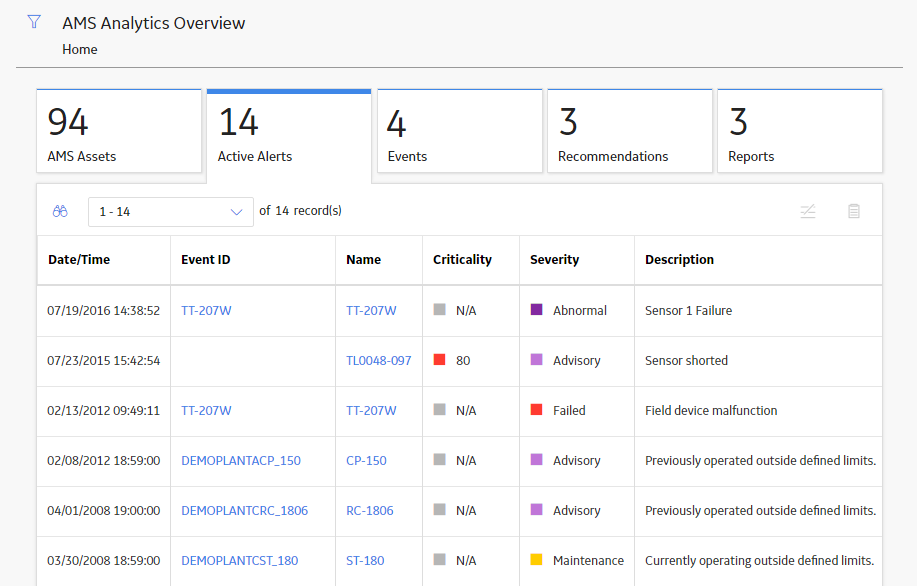
- Active Alerts: Contains a table of AMS Asset Alerts that are marked as active.
- Events: Contains a table of AMS Asset Events.
- Recommendations: Contains a table of open AMS Asset Recommendations (that is, Recommendations whose state is not closed, superseded, or rejected).
- Reports: Contains a table of reports that are located in the Catalog folder \\Public\Meridium\Modules\AMS Asset Portal\Summary Reports.
- Alert Trend: Contains the number of active AMS Asset Alerts for each of the last 11 months and the current month.
- Events by Type: Contains the number of AMS Asset Events for each event type.
- Active Alerts by Asset Criticality: Contains the number of active AMS Asset Alerts for each range of criticalities.
- Active Alerts by Duration: Contains the amount of time that the AMS Asset Alerts have been active.
- Active Alerts by Severity: Contains the number of active AMS Asset Alerts for each severity.
- Assets by Criticality: Contains the number of AMS Assets for each range of criticalities.
- Assets by Type: Contains the number of AMS Assets for each event type.
- Assets by Health: Contains the number of AMS Assets for each range of health index values (that is, the values in the Health Index field in the AMS Asset records).
 to filter the information displayed in the AMS Analytics Overview page based on a specific asset (for example, Equipment or Functional Location). When you filter by an asset, each section in the page, except the Reports section, displays the information for the selected asset and the assets under it in the hierarchy.
Create an AMS Recommendation Based on an Alert or Event
Procedure
- Select the Active Alerts or the Events tab.
The corresponding section appears.
- In the upper-right corner of the section, select
 .
.The Record Manager page appears, displaying a new AMS Asset Recommendation record with some fields populated automatically.
- Select
 .
. The recommendation is saved.
Results
An AMS Asset Recommendation record is added to the GE Digital APM database and linked to the AMS Asset record with which the alert or event was associated.
View Detailed Reports for AMS Asset, Alert, or Event
Procedure
- Select one of the following tabs:
- Active Alerts
- Events
- AMS Assets
The corresponding section appears.
- In the upper-right corner of the section, select
 .
.The corresponding report is displayed in the <Report Name> page, where <Report Name> is the name of the corresponding report in the Detailed Reports folder in the Catalog.
About the Color-Coding Used in AMS Analytics
Health Index
The following table shows the color associated with each health index range for an AMS Asset and what it indicates about the health of the piece of equipment or location.
|
Health Index Range |
Color |
Health of Equipment or Functional Location |
|---|---|---|
|
0 - 19 |
Red |
Poor |
|
20-79 |
Yellow |
Moderate |
|
80-99 |
Purple |
Good |
|
100 |
Green |
Perfect |
Criticality
The following table shows the colors associated with each criticality range for an AMS Asset and the level of criticality that it represents.
|
Criticality Range |
Color | Criticality Level |
|---|---|---|
|
1-19 |
Light Blue | Low |
|
20-39 |
Green | Medium |
|
40-59 |
Yellow | High |
|
60-79 |
Orange | Very High |
|
80-100 |
Red | Extreme |
Severity
The following table shows the possible severity levels for AMS Assets and AMS Alerts and the color that represents each level.
|
Severity Level |
Color |
|---|---|
|
Maintenance |
Yellow |
|
Advisory Abnormal |
Purple |
|
Expired |
Orange |
|
Communication Failure Failed |
Red |
|
Default / Not defined |
Gray |
View an Alert Trend for an AMS Asset
Procedure
- Select the AMS Assets tab.
The AMS Assets list appears.
- At the top of the grid, select
 , and then select the type of graph you want to view (i.e., Alerts by Description or Alerts by Severity).
 The Enter Parameter Values window appears.
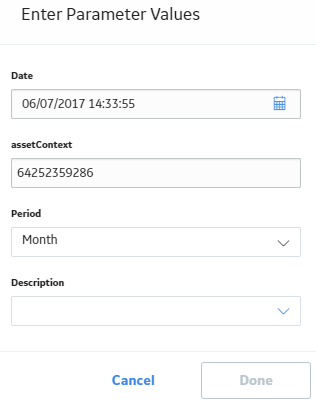
- On the Enter Parameter Values window, select the following values:
- Date
- assetContext
- Period
- Description
The Graph Result workspace opens, displaying selected graph.
Important: If you are viewing the Asset Alert Trend by Description graph, you must specify the Graph Dimensions before the graph will appear.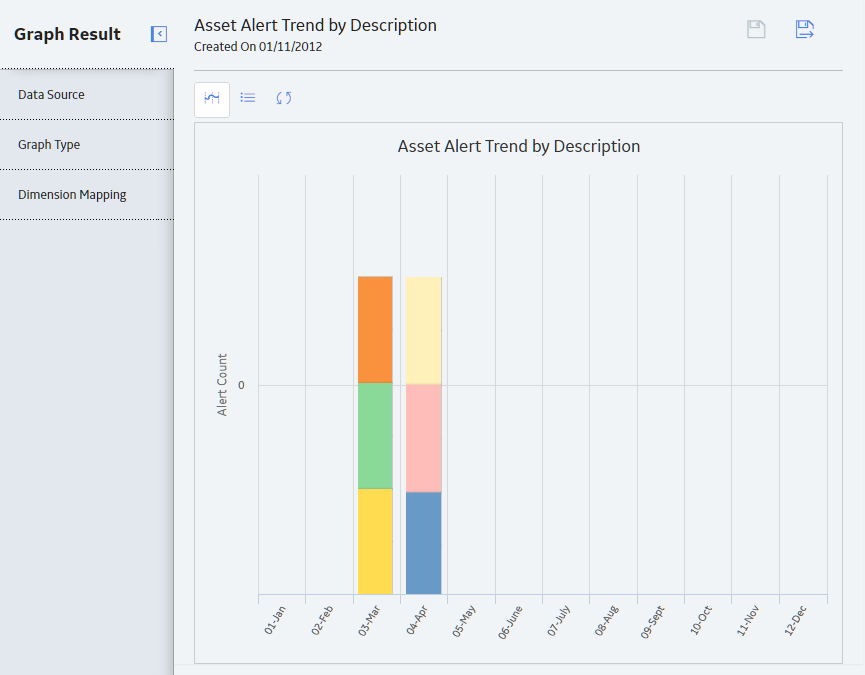 Tip: You can use the standard Graph features to view additional details or modify graph settings.