General Reference
An Example of a Root Cause Analysis
The sections in this topic correspond to each step in the workflow for developing a Root Cause Analysis. In each section, the workflow for creating an RCA will be illustrated through examining the recurring failure(s) of a cooling water pump. The data used in each of the sections is listed in tables. In the tables, we list only the fields that contain a value. In the case of numeric fields, this includes fields that contain a value of zero (0). Fields that contain no value are not listed in the tables. The information in tables is provided for your reference.
Define criteria for when an RCA should be performed
Before you can begin conducting an RCA, you must establish the criteria that standardizes when an RCA should be performed. For example, the manager of the plant, where a cooling water pump exists, might specify criteria as:
-
If any pump fails one or more times per week for more than two successive weeks, regardless of the cost for repairs, an RCA study should be conducted.
-or-
- If any pump fails catastrophically (e.g., causes the system to shut off), an RCA should be conducted.
Now, assume that in January 2015, the bearing temperature alarm, on the outboard bearing of a cooling water pump, sounded. By the time the operator arrived, the motor bearing temperature had increased to a point that the protective bearing temperature circuit caused the pump to shut down, resulting in loss of production. According to the criteria that was developed, these conditions dictate that an RCA should be performed. The first step is to create the analysis.
Create an RCA
If water pump failure meets the criteria for requiring an RCA, the first step is to create the analysis. The user who will serve as the Principal Analyst can complete this step and initiate the development of the RCA for the recurring failures of the cooling water pump.
- Access the RCA Overview page.
-
In the upper-right corner of the page, select New Analysis.
A blank datasheet appears in the Analysis Summary workspace.
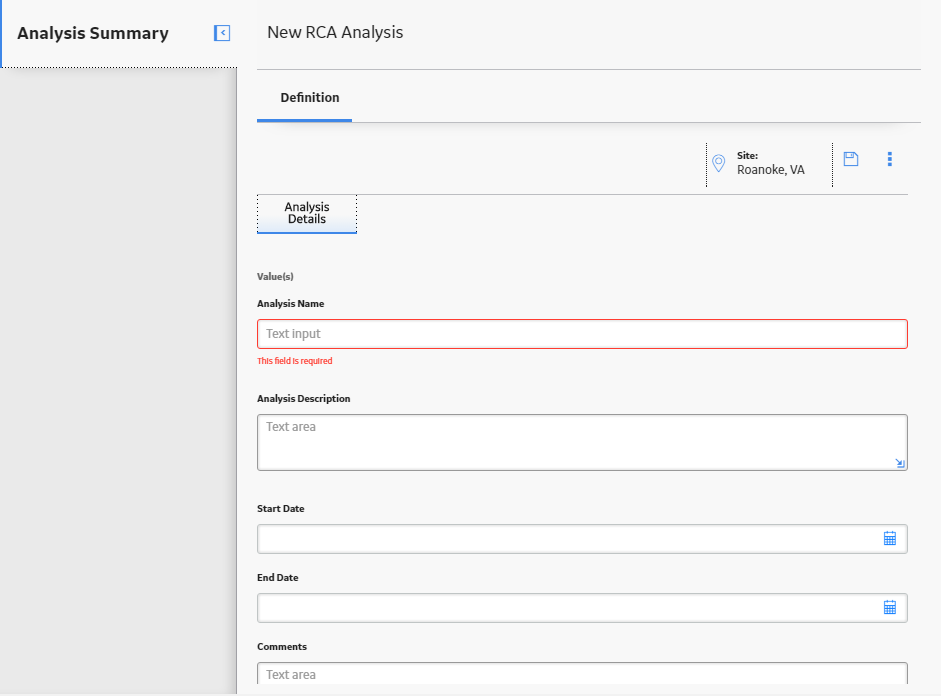
-
Enter the values in the fields on the datasheet. For this example, you should create root cause analysis that contains the information as it appears in the following table:
Field Value Analysis Name Cooling Water Pump Analysis Description An analysis to determine the root cause of the pump overheating. Start Date 01/06/2018 End Date 01/15/2018 Comments Comments Analysis Type Mechanical Event Narrative Investigate what caused the motor temperature in the water pump to increase and overheat. Cost 20,000 Frequency 1
Number 1 represents the number of failures that occurred for the cooling water pump
-
Select
 .
.The Root Cause Analysis is saved.
Link the Assets on which the RCA is based
-
In the workspace, select the Linked Assets tab.
The Linked Assets section appears.
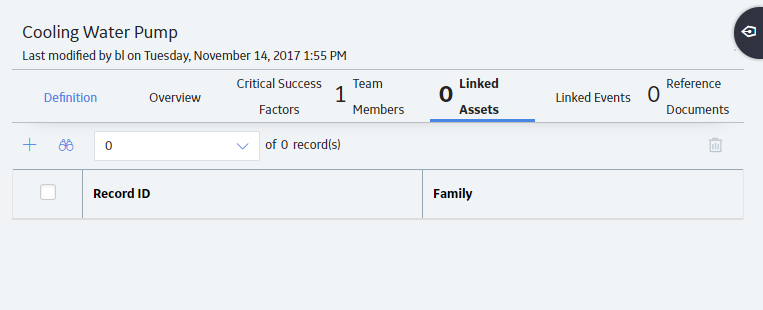
-
Select
 .
. The Asset Finder window appears.
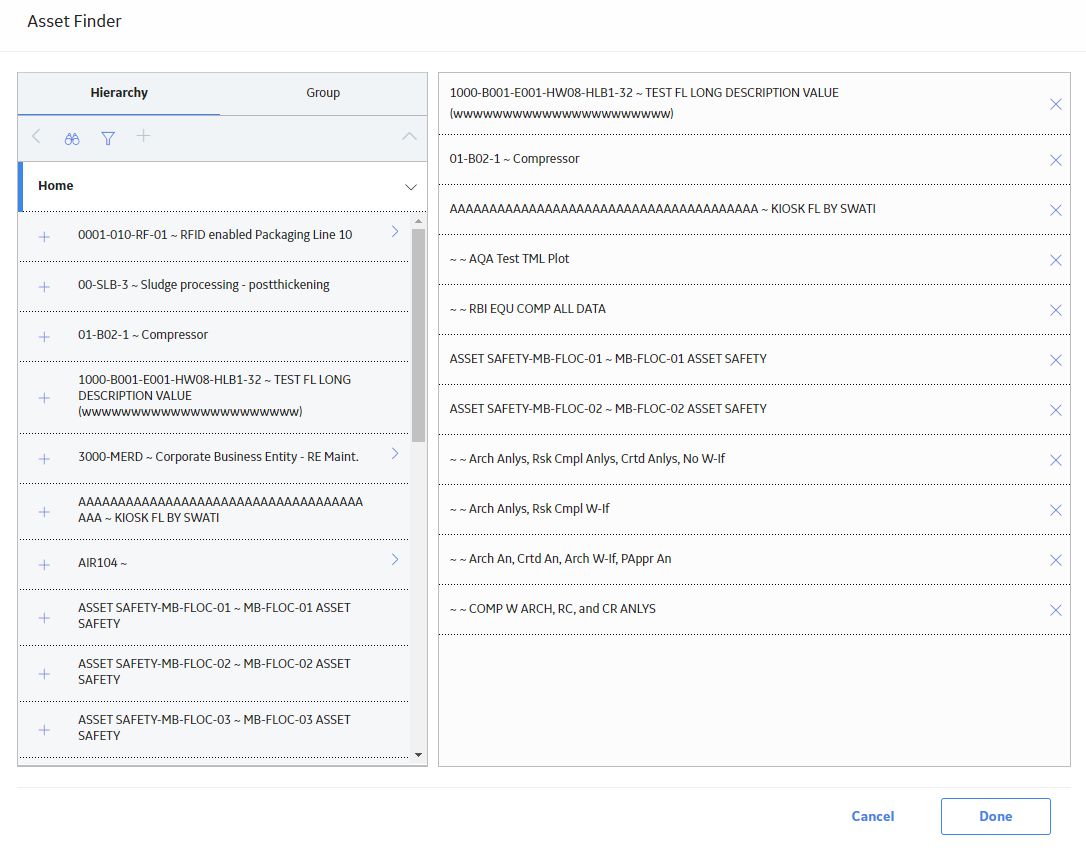
-
Search for PUMP and select it.
PUMP is listed in the Linked Assets section.
Select the members of the RCA team
-
Select
 .
.The list of human resources appears in the left section and the list of team members appears in the right section.
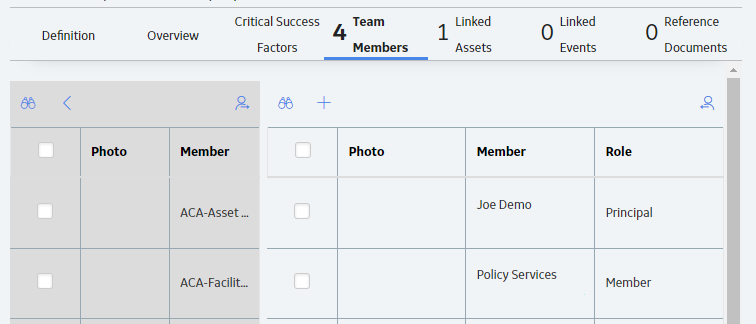
- From the list of human resources, select the check box to the left of the following names to add as team members:
-
The analyst, Suzie Jones, to help gather information surrounding the failure.
-
The mechanic, Pete Handy, because he will repair the cooling water pump.
-
The engineer, Bob Speck, because he is an expert on systems and safety guidelines.
-
-
Select
 .
.The selected names are added to the list of team members in the right section.
The Principal Analyst is Jane Doe, who is an expert on facilitating team discussion and documenting discussion notes.
Note: By default, the human resource that created an analysis will be added automatically as a team member and assigned the Principal Analyst role. You can change the Principal Analyst for an RCA.
Add Critical Success Factors
-
In the workspace, select the Critical Success Factors tab.
The CSF section appears.
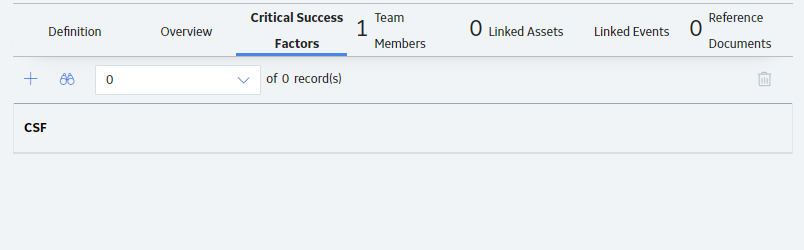
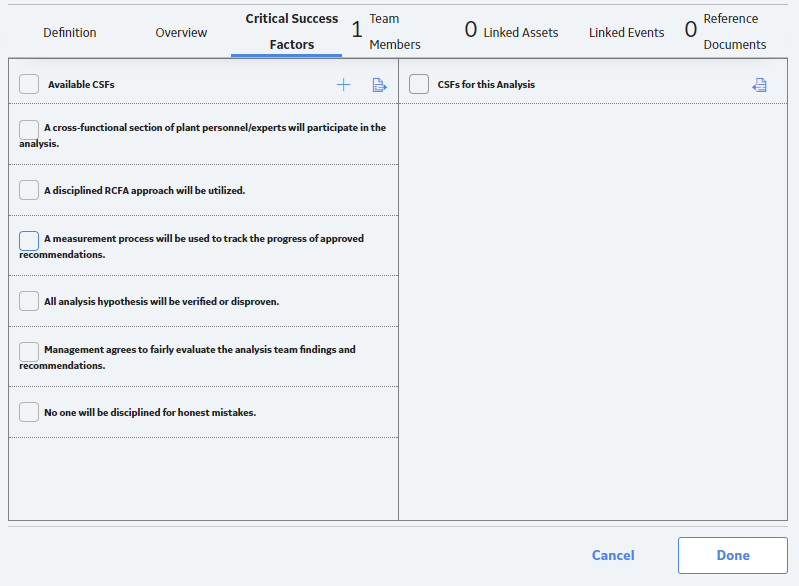
-
In the upper-left corner of the workspace, select
. The Available CSFs and the CSFs for this Analysis subsections appear. The Available CSFs subsection contains the following Critical Success Factors that an administrative user has pre-configured for use with RCA:
- A cross-functional section of plant personnel/experts will participate in the analysis.
- A disciplined RCFA approach will be utilized.
- A measurement process will be used to track the progress of approved recommendations.
- All analysis hypothesis will be verified or disapproved.
- Management agrees to fairly evaluate the analysis team findings and recommendations.
- No one will be disciplined for honest mistakes.
Specify the Team Charter
- In the workspace, select the Definition tab.
The Definition section appears.
- In the Charter field, enter the following text:
To identify the root causes of the cooling water pump failure. This includes identifying deficiencies in or lack of management systems. Necessary recommendations for root causes will be communicated to the management for rapid resolutions.
- Select .
The Charter field is updated.
Preserve Failure Event Data
You can preserve failure event data by creating an RCA Preserve Record, which contains a data-collection task that should be completed by the team member to whom the Preserve Record is assigned. Each task can be categorized according to the 5 P's (i.e., Parts, Paper, People, Position, Paradigms), which indicates the type of data that should be collected.
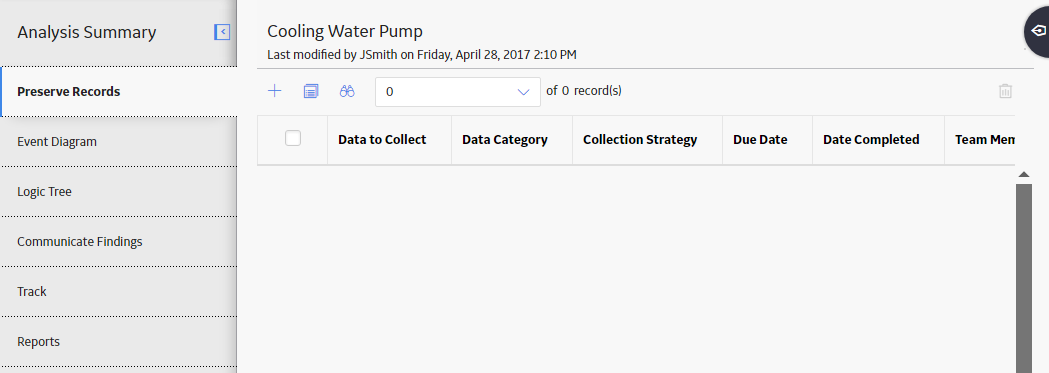
- In the left pane, select the Preserve Records
tab.
The Preserve Records workspace appears.
- In the upper-left corner of the workspace, select .
The New Preserve Record window appears.
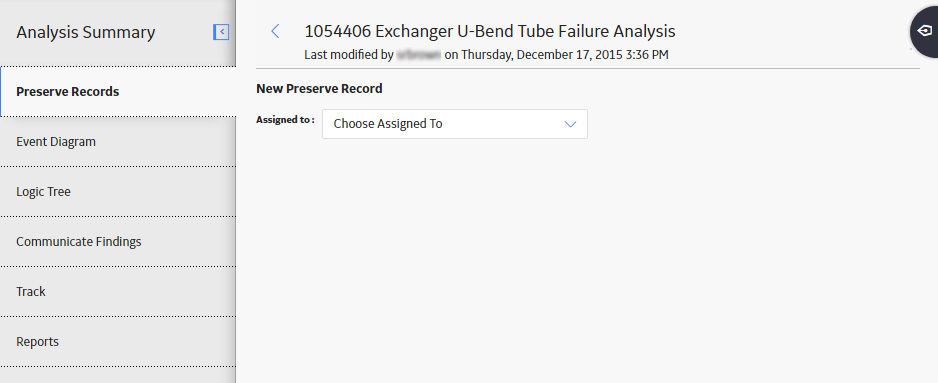
- In the Assigned to list, select the team member to whom you want to assign the Preserve Records, and then enter values in the available fields on the Preserve Records datasheet.
For this example, you should create RCA Preserve records that contain the information as it appears in each of the following tables:
RCA Preserve Record 1 Field Value (s) Assigned To Pete Handy Data Category Parts Data to Collect The pieces of the cooling water pump that could have caused the pump to overheat. Collection Strategy Document (pictures and observations) the condition of the components of the pump. Date Due 01/08/2018 Send Alert on Due Date? True Days Before Due Date to Be Notified 1 Frequency of Alert After Due Date Daily Alert Email Body This is a reminder to gather and document the pieces of the pump that could have caused the pump to overheat and report back to the team. Completed? No Date Completed N/A RCA Preserve 2 Field Value (s) Assigned To Suzie Jones Data Category Paper Data to Collect Standard operating procedures and frequent failure information Collection Strategy Research Date Due 01/9/2018 Send Alert on Due Date? True Days Before Due Date to Be Notified 1 Frequency of Alert After Due Date Daily Alert Email Body This is a reminder to gather the standard operating procedures and frequent failure information and report back to the team. Completed? No Date Completed N/A RCA Preserve Record 3 Field Value (s) Assigned To Bob Speck Data Category People Data to Collect Operating procedures used by those who maintain the pump. Collection Strategy Interview the floor operators who are assigned to the pump. Date Due 01/10/2018 Send Alert on Due Date? True Days Before Due Date to Be Notified 1 Frequency of Alert After Due Date Daily Alert Email Body This is a reminder to interview operators assigned to the pump and document their operating procedures and report back to the team. Completed? No Date Completed N/A RCA Preserve Record 4 Field Value (s) Assign To Bob Speck Data Category People Data to Collect Environment surrounding the pump. Collection Strategy Tools, pictures, diagrams Date Due 01/10/2018 Send Alert on Due Date? True Days Before Due Date to Be Notified 1 Frequency of Alert After Due Date Daily Alert Email Body This is a reminder to investigate the environment where the pump exists and report back to the team. Completed? No Date Completed N/A RCA Preserve Record 5 Field Value (s) Assigned To Jane Doe (Principal Analyst) Data Category Paradigms Data to Collect Common assumptions made when a pump fails. Collection Strategy Research and interview. Date Due 01/10/2018 Send Alert on Due Date? False Completed? No Date Completed N/A
After each team member has collected the data that is specified in the RCA Preserve Record, they should record their findings for the rest of the team through artifacts, including Reference Documents and hard copies of documents. After all the RCA Preserve Records have been completed, the team can begin to analyze the data.
Analyzing data
After the team has preserved the failure data, the team can begin to analyze the data. To help you visualize the event and organize the team's hypotheses and analysis, you should create an Event Diagram or a Logic Tree depending on your requirement. For our example, we will create a Logic Tree diagram.
- In the left pane, select the Logic Tree tab.
A blank datasheet appears.
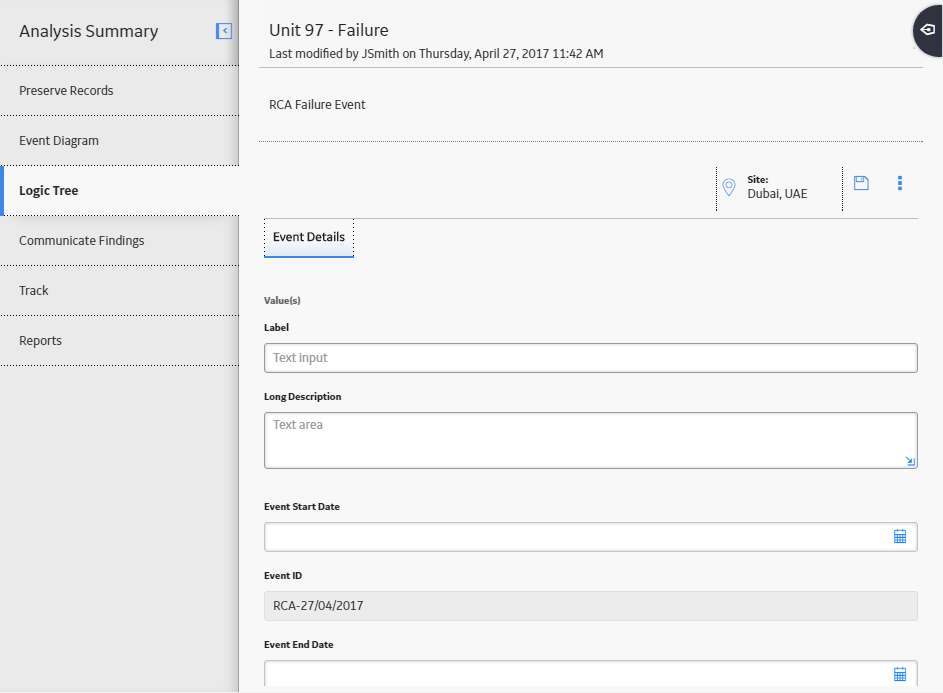
- Enter the following values:
Field Value (s) Event End Date 01/15/2018 Event ID RCA-01/15/2018
Note: The Event ID field is populated automatically with the date the is created and is disabled so that value cannot be changed. If you choose to re-create this example RCA Event, your Event ID value will be different from the value listed here.Event Start Date 01/06/2018 Label Overheating in Pump 1 Long Description Investigate the cause of a cooling water pump to overheat and shut down the system. - Select .
The Failure Event node appears in the design canvas in the Logic Tree workspace.
- In the upper portion of the workspace, in the Palette
section, select
 , and then use the drag-and-drop method to add the icon to the Failure Event
node in the design canvas.
, and then use the drag-and-drop method to add the icon to the Failure Event
node in the design canvas. - Select the Failure Mode that you added.
The Properties window appears.
- Enter the following information to define the Failure Mode, and then select
:
RCA Failure Mode ID Value (s) No Spare Parts Label: No Spare Parts
Description: No spare parts caused the pump to be out of commission for a longer amount of time.
- Add another Failure Mode using the following information:
RCA Failure Mode ID Value (s) Motor tripped due to high temperature. Label: Motor tripped due to high temperature.
Description: The motor shut off because the temperature became too hot and the system was shut down.
- Diagram the events that led up to and immediately followed the failure
event. For this example, you would create the Event Diagram as shown in the
following image. The team should note the trend in the failures that occurred in
the past. In this way, the team may be able to identify a pattern in the events
prior to the RCA that may indicate the underlying cause(s) for these failures.
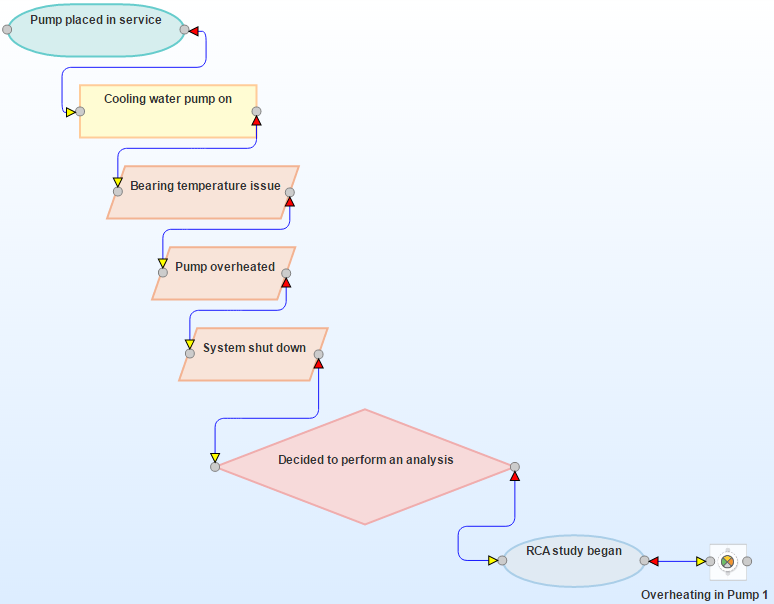
This example contains nine RCA Sequence Nodes, which are displayed on the Event Diagram.
Sequence Nodes in Event Diagram
For each RCA Sequence Node, the following table lists the type of node and the values that exist in the RCA Sequence Node.
Type of Node Values Start/Finish
Label: Pump place into service
Event Start Date: 1/1/2014 12:00 AM
Event End Date: 1/1/2014 12:00 AM
Process
Label: Cooling water pump turned on daily
Event Start Date: 1/1/2014 12:00 AM
Event End Date: 1/6/2015 12:00 AM
Operation
Label: Bearing Temperature Alarm sounded
Event Start Date: 1/6/2015 12:00 AM
Event End Date: 1/6/2015 12:00 AM
Operation
Label: Pump Overheated
Event Start Date: 1/6/2015 12:00 AM
Event End Date: 1/6/2015 12:00 AM
Operation
Label: System shut down
Event Start Date: 1/6/2015 12:00 AM
Event End Date: 1/6/2015 12:00 AM
Decision
Label: Decided to perform an analysis
Event Start Date: 1/6/2015 12:00 AM
Event End Date: 1/6/2015 12:00 AM
Start/Finish
Label: RCA Study began
Event Start Date: 1/6/2015 12:00 AM
Event End Date: 1/16/2015 12:00 AM
- At the top of the workspace, in the Palette section,
select
 above the design canvas, and then use the drag-and-drop method to add the
icon to the Hypothesis in the design canvas.
above the design canvas, and then use the drag-and-drop method to add the
icon to the Hypothesis in the design canvas. - Select the Hypothesis that you added.
The Properties window appears.
- Enter the following information to define each of the Hypotheses required
for our example.
RCA Hypothesis ID Value (s) Level 1 Mechanical Label: Mechanical
Descriptions: The increase in temperature was due to a mechanical failure.
Confidence Factor: Likely (3)
State: Hypothesis True
Electrical Label: Electrical
Descriptions: The increase in temperature was due to an electrical failure.
Confidence Factor: Possibly True (2)
State: Hypothesis Not True
Level 2 Outboard bearing Label: Outboard bearing
Descriptions: The outboard bearing had a mechanical problem.
Confidence Factor: Highly Likely (4)
State: Hypothesis True
Inboard bearing Label: Inboard bearing
Descriptions: The inboard bearing had a mechanical problem.
Confidence Factor: Somewhat True (1)
State: Hypothesis Not True
Level 3 Erosion Label: Erosion
Descriptions: The outboard bearing eroded after overuse.
Confidence Factor: Somewhat True (1)
State: Hypothesis Not True
Corrosion Label: Corrosion
Descriptions: The outboard bearing corroded and was rusty.
Confidence Factor: Somewhat True (1)
State: Hypothesis Not True
Fatigue Label: Fatigue
Descriptions: The outboard bearing was overheated due to a weakness of materials.
Confidence Factor: Highly Likely (4)
State: Hypothesis Not True
Level 4 Misalignment Label: Misalignment
Descriptions: The outboard bearing was not aligned correctly.
Confidence Factor: Possibly True (2)
State: Hypothesis Not True
Loose Bolts Label: Loose Bolts
Descriptions: Bolts were loose and caused the outboard bearing to become loose.
Confidence Factor: Possibly True (2)
State: Hypothesis Not True
Lubrication Issue Label: Lubrication Issue
Descriptions: The outboard bearing was not receiving the right amount of lubrication.
Confidence Factor: Highly Likely (4)
State: Cause Physical
Level 5 Leak Label: Leak
Descriptions: The lubricant was leaking from the pump.
Confidence Factor: Possibly True (2)
State: Hypothesis Not True
Too Much Applied Label: Too much applied
Descriptions: There was too much lubricant, causing, the bearing to operate too quickly and overheat.
Confidence Factor: Possibly True (2)
State: Hypothesis Not True
Too Little Applied Label: Too little applied
Descriptions: There was not enough lubricant, causing friction and an increase in temperature.
Confidence Factor: Likely (3)
State: Cause Human
Level 6 Poor Training Label: Poor training
Descriptions: Workers were not properly training on applying lubricant to the bearing.
Confidence Factor: Possibly True (2)
State: Hypothesis Not True
Inadequate Procedures Documented Label: Inadequate Procedures Documented
Descriptions: Workers are referencing procedure documentation that is not clear.
Confidence Factor: Possibly True (2)
State: Hypothesis Not True
Worker Fatigue Label: Worker Fatigue
Descriptions: Workers are overworked and are not able to perform at an acceptable level.
Confidence Factor: Likely (3)
State: Cause Physical
Inadequate Accountability of Workers Label: Inadequate Accountability of Workers
Descriptions: Workers are not being held accountable for the maintenance procedures they are required to perform.
Confidence Factor: Highly Likely (4)
State: Cause Latent
Diagram each failure mode in detail. For this example, you would create a Logic Tree like the one shown in the following image:
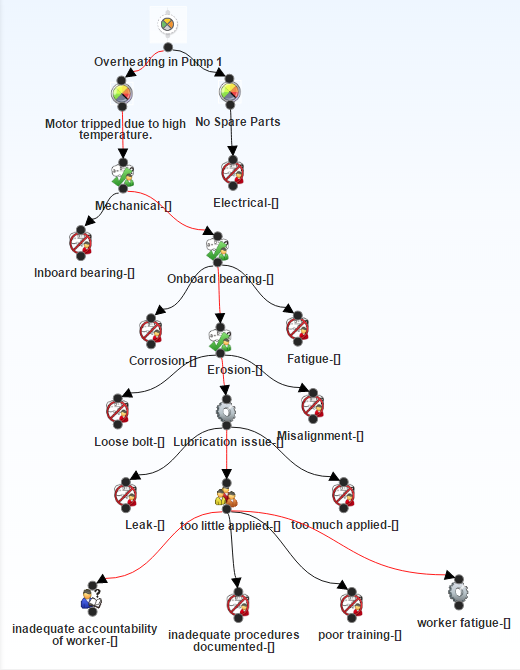
In the Logic Tree in this image, you can see that two Failure Mode nodes are linked to the Failure Event node, and multiple Hypothesis nodes are linked to the Motor Tripped due to high temperature Failure Mode node.
This example contains four RCA Logic Gates, which represent Logic Gate nodes and are used in the Logic Tree. You must enable Logic Gates to view them on the Logic Tree.
Example Data in Logic Gates
In the following table, the Logic Gates are numbered as they appear in the Logic Tree from left to right. For each RCA Logic Gate, the table displays the value in the Gate Type field of the RCA Logic Gate and identifying information about the node (e.g., RCA Failure Mode) to which it is linked.
RCA Logic Gate Value Specified Linked To 1
Gate Type: OR
RCA Failure Mode: Motor tripped due to high temperature
RCA Hypothesis: Mechanical
RCA Hypothesis: Electrical
2
Gate Type: OR
RCA Failure Mode: Motor tripped due to high temperature
RCA Hypothesis: Mechanical
RCA Hypothesis: Inboard bearing
RCA Hypothesis: Outboard bearing
3
Gate Type: OR
RCA Failure Mode: Motor tripped due to high temperature
RCA Hypothesis: Outboard bearing
RCA Hypothesis: Corrosion
RCA Hypothesis: Erosion
RCA Hypothesis: Fatigue
4
Gate Type: OR
RCA Failure Mode: Motor tripped due to high temperature
RCA Hypothesis: Fatigue
RCA Hypothesis: Loose Bolts
RCA Hypothesis: Lubrication Issue
RCA Hypothesis: Misalignment
5
Gate Type: OR
RCA Failure Mode: Motor tripped due to high temperature
RCA Hypothesis: Lubrication Issue
RCA Hypothesis: Leak
RCA Hypothesis: Too Little Applied
RCA Hypothesis: Too Much Applied
6
Gate Type: OR
RCA Failure Mode: Motor tripped due to high temperature
RCA Hypothesis: Too Little Applied
RCA Hypothesis: Inadequate Accountability of Workers
RCA Hypothesis: Inadequate Procedures Documented
RCA Hypothesis: Poor Training
RCA Hypothesis: Worker Fatigue
Now that several likely hypotheses have been introduced, the team will need to rule out hypotheses. To rule out a hypothesis or prove a hypothesis, the hypothesis will need to be tested against the data that is available to the team (i.e., the failure event data and the team of experts).
As described in the next step, the Principal Analyst should create RCA Verifications and assign them to team members who will be responsible for completing the associated task.
- Select the Hypothesis that you want to verify.
- In the lower-left corner of the workspace, select the Verifications tab.
The Verifications pane appears.
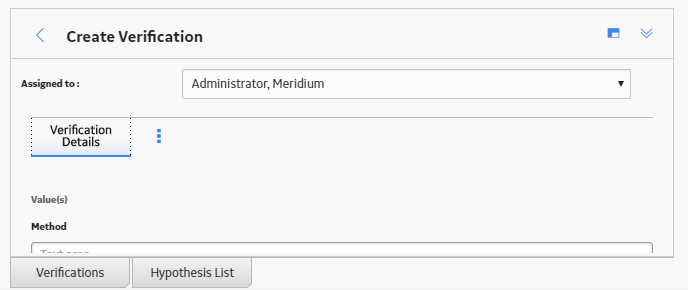
- Above the list, select .
The Create Verification pane appears.
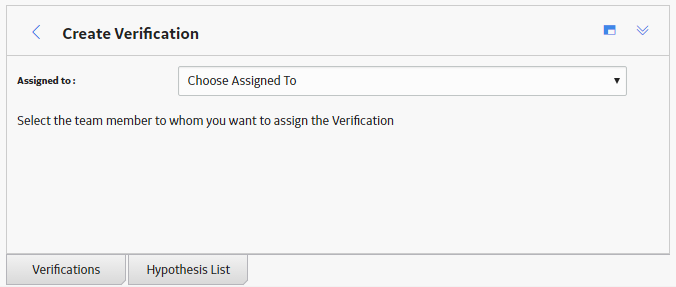
- In the Assigned to list, select the team member to whom
you want to assign the Verification.
A blank datasheet appears.
- Enter the details in the available fields based on the following information
to define each of the Verification required for our example, and then select
.
RCA Verification ID Values Specified Inspect wiring to make sure that the cause was not electrical. Due Date: 1/10/2015
Method: Inspect wiring to make sure that the cause was not electrical.
Completed: No
Perform a metallurgical analysis to determine why the bearing failed. Due Date: 1/10/2015
Method: Perform a metallurgical analysis to determine why the bearing failed.
Completed: False
The following image shows an example of an RCA Verification that contains a task to test the Mechanical hypothesis.
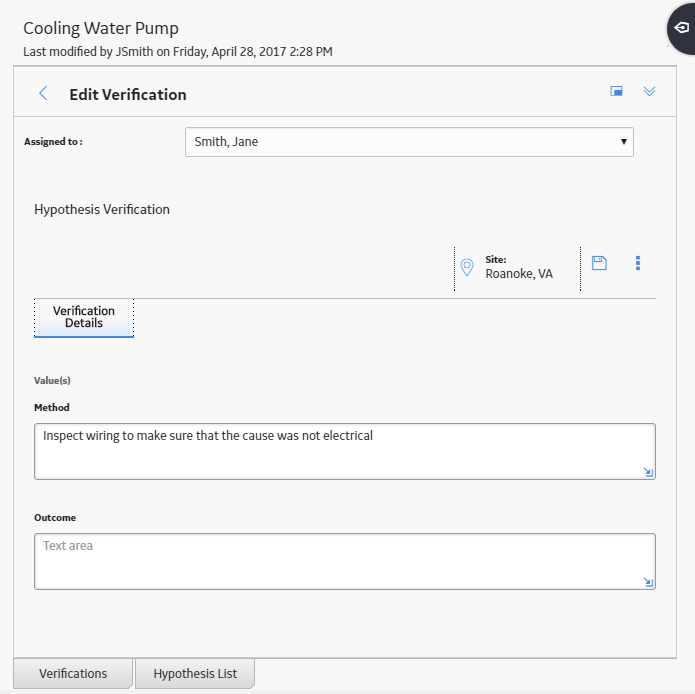
The task defined in this RCA Verification instructs the team member to inspect the wiring for the cooling water pump to ensure that the problem was not electrical, but mechanical.
When a hypothesis has been tested, you must change the state of the associated RCA Hypothesis, as described in the next step.
- Select the Hypothesis whose state you want to change.
- At the top of the workspace, in the States panel,
select one of the following options, and then select :
- Hypothesis True if the hypothesis has been confirmed. After you determine a hypothesis to be true, you can identify the root cause of the Failure Event.
- Hypothesis Not True if the hypothesis has been ruled out.
For example, the following image shows the Logic Tree after Pete Handy has completed the RCA Verification to which he was assigned. Pete Handy concluded that the wiring did not the cause the pump to overheat, so the problem must be mechanical.
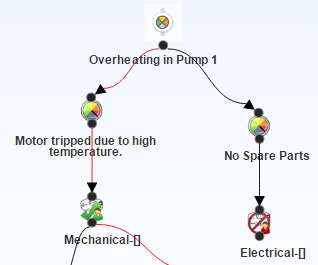
After the state of the Mechanical RCA Hypothesis is set to True, the team can continue down the Logic Tree until they identify the root cause. Causes can be further identified as physical, human, or latent. For example, the following image shows the Logic Tree after ALL the RCA Verifications have been completed. The team has concluded that inadequate accountability of workers has led to insufficient lubricant being applied to the outboard bearing, which caused the motor's temperature to increase and the pump to overheat.
In this case, the root cause for the pump failure would be identified as latent (i.e., inadequate accountability of workers), which lead to human (i.e., too little applied) and physical (i.e., lubrication issue) causes. Now that a hypothesis has been verified and the root cause has been determined, you can create RCA Recommendations to communicate your findings on how to prevent this failure in the future.
If the hypothesis is not true but you cannot rule out the hypothesis and set the state to False, you can assign a probability to the hypothesis to include the team in determining the possibility of the hypothetical cause.
Communicating findings and recommendations
Now that the team has determined the root cause of the cooling water pump failure to be inadequate accountability of workers, you will want to record your findings and create RCA Recommendations. After recommendations have been implemented, you can share the results of the RCA with others. You can access the RCA Overview page to view the financial effects of implementing the recommendations. For our example, we will create one Recommendation record.
- Access the Root Cause Analysis for which you want to create a recommendation.
- In the upper-right corner the workspace, select the
 .
.The Recommendations pane appears.
- Select .
The RCA Recommendation datasheet appears.
- On the General Information tab, enter the following details in the available fields:
Field Description Alert Responsible Party When Due?
True
Analysis ID
Cooling Water Pump
Assigned to Name
Suzie Jones
Author Name
Jane Doe
Business Impact
Production (PRODUCTION)
Cause
Inadequate accountability of workers.
Cause Type
Cause Latent
Days Before Due Date To Be Alerted?
4
Final Approver Name
Jane Doe
Frequency of Alert After Due Date
Daily
Implementation Alert Text
You have less than 4 days to complete the new required report.
Mandatory Date
2/28/2015
Recommendation Description
This report will require workers to document each time they perform a routine procedure, which will hold them accountable for pump maintenance.
Recommendation Headline
Create a new performed maintenance report.
Recommendation ID
REC-1376
Recommendation Priority
Medium (Medium)
Required Equipment Status
On-Line (ON-LINE)
Reviewer Name
Jane Doe
Status
Created (CREATED)
Target Completion Date
Monday, February 20, 2015
- If you want to schedule a recommendation alert email to be sent to a specified recipient, select the Alert tab, and enter the necessary information on the datasheet.
- Select .
The RCA Recommendation is saved to the database and linked to the analysis for the selected Root Cause analysis.
After you have successfully identified the root causes associated with the failure that was investigated, you can communicate the findings and propose recommendations to the appropriate individuals within your organization. You can communicate the findings via a hyperlink to the analysis or via a summary report through email to selected recipients.
Tracking Results
After the RCA findings have been communicated and the recommendation has been implemented, the team will want to track the effectiveness of the recommendation to see if the new report has prevented the cooling water pump from failing thus far. Tracking for results involves creating RCA Tracking Items, scheduling the Tracking Evaluations in the GE Digital APM Schedule Manager, and modifying the existing recommendation or creating a new one based on the discoveries that are made through reevaluation.
For our example, we will create one tracking item.
- Access the RCA within which you want to create a new Tracking Item.
- In the left pane, select the Track tab.
The Track workspace appears.
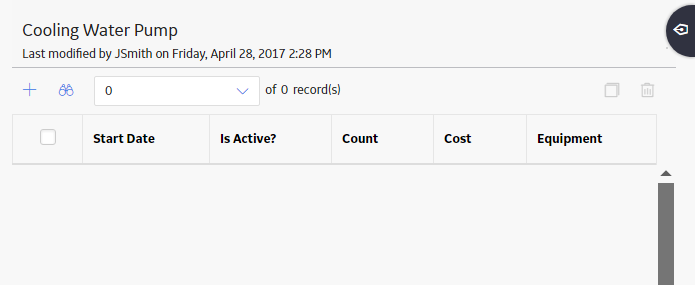
- In the upper-left corner of the workspace, select .
The Add/Edit Tracking Item window appears, displaying a blank datasheet.
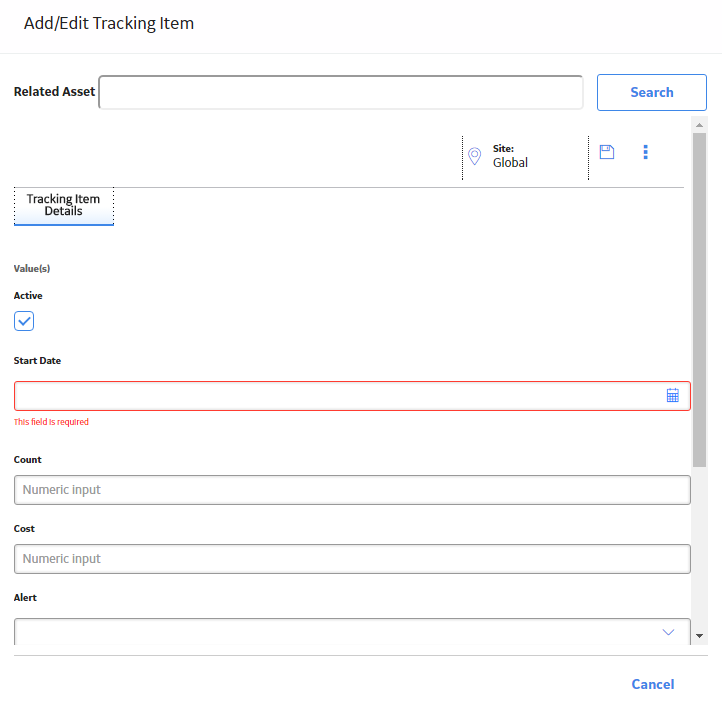
- Enter the following information in the available fields:
Field Description Active
True
Start Date
3/1/2015
Count
2
Cost
10,000
Alert
Williams, Bob
Note: Williams, Bob will receive an e-mail that alerts him that the performance of the cooling pump has again fallen below the tolerable limits or that the corrective actions from the first RCA were ineffective.Message Subject
Cooling Water Pump Improvement
Message Text
Cooling water pump 1 has failed and needs to be re-evaluated. The reason for the failure is that the performance of the cooling pump has again fallen below the tolerable limits or that the corrective actions from the first RCA were ineffective.
- Select .
The Tracking Item is saved.
About Site Filtering in Root Cause Analysis
An RCA is assigned a site on the Definition workspace and spread to all the related records, such as Logic Tree records and RCA Event records.
In RCA, users will see only Root Cause Analyses that are assigned to their site(s) or that are global records. In the Linked Assets section for a Root Cause Analysis, users will see all of the assets linked to the Root Cause Analysis, but will only be able to access those assets to which they have the necessary permissions.
Example
Consider an organization that has three sites, Site X, Site Y, and Site Z. The following RCA Analysis records exist:
- RCA Analysis A: Assigned to Site X
- RCA Analysis B: Assigned to Site Y
- RCA Analysis C: Assigned to Site Z
- RCA Analysis D: No site assigned (global record)
Scenario 1: User assigned to only Site X
This user will see RCA Analysis A and RCA Analysis D.
Scenario 2: User assigned to both Site X and Site Y
This user will see RCA Analyses A, B and D.
Scenario 3: Super User
This will see RCA Analyses A, B, C and D.
Root Cause Analysis Data Model
The Root Cause Analysis data model uses families to represent the various components of an RCA, as defined by the standard, accepted PROACT for RCA methodology. GE Digital APM leverages its fundamental entity and relationship family infrastructure to store data related to an RCA.
Each RCA is represented at the root level by an RCA. The RCA can be linked to an RCA Event through the RCA Relationship. RCA Events can, in turn, be linked to RCA Failure Modes, RCA Sequence Nodes, and so on for all components of the RCA. Together, the RCA and all the records that are linked to it, either directly or indirectly, make up the Root Cause Analysis.
The following image shows the entity families and relationship families that are used to create an RCA.
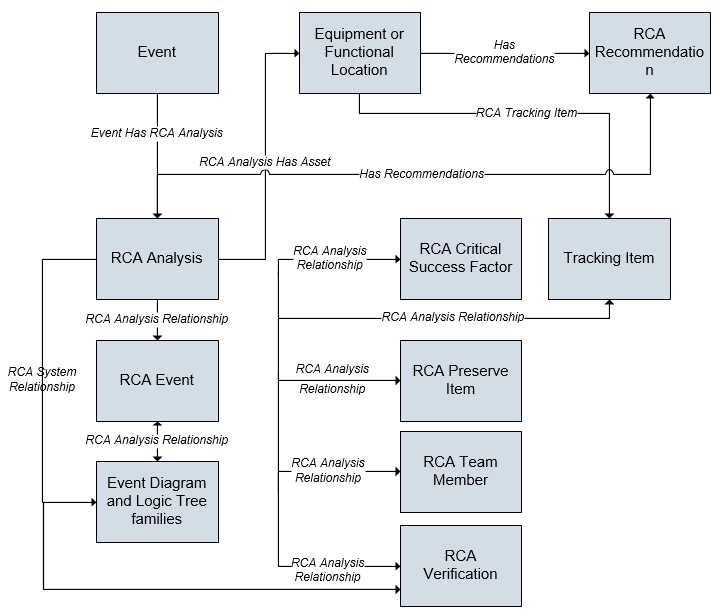
The Root Cause Analysis Best Practice specifies that you will create RCA Analyses either for equipment or functional locations. Either option may be valid, depending on the analysis. Throughout the RCA documentation, we assume that you are following the GE Digital APM best practice and storing your equipment and functional location information in Equipment and Functional Location records. Additionally, we assume that you are following the RCA Best Practice and linking your RCA records to either Equipment or Functional Location records.
In addition to the relationships that appear in this image, records in the following families can be linked to records in the RCA Reference Document family through a relationship definition on the Has Reference Documents family:
- RCA Analysis
- RCA Critical Success Factor
- RCA Event
- RCA Failure Mode
- RCA Preserve Item
- RCA Recommendation
- RCA Team Member
- RCA Tracking Item
- RCA Verification
Additionally, the following families are used by the RCA module but are not related to any other family in the data model:
- The RCA Image family is used to display an image of the Event Diagram and the Logic Tree in the Comprehensive Analysis Report.
- The Alert family is used to send alert emails.
Root Cause Analysis URLs
There is one URL route associated with Root Cause Analysis: rca. The following table describes the various paths that build on the route, and the elements that you can specify for each.
| Element | Description | Accepted Value(s) | Notes |
|---|---|---|---|
|
rca/dashboard/<EntityKey>: Displays the Root Cause Analysis overview page. | |||
| <EntityKey> | Specifies which analysis you want to view. |
The Entity Key of the desired analysis. |
This parameter is required and refers to the analysis. Without the Entity Key, the URL will not be supported. |
| 0 | Displays the home level of the asset hierarchy. | ||
|
rca/shell/<EntityKey>/mainrca: Displays the Analysis Summary workspace of the desired analysis. rca/shell/<EntityKey>/preserverecord: Displays the Preserve Records workspace of the desired analysis. rca/shell/<EntityKey>/ediag: Displays the Event Diagram workspace of the desired analysis. rca/shell/<EntityKey>/ltree: Displays the Logic Tree workspace of the desired analysis. rca/shell/<EntityKey>/cfindings: Displays the Communicate Findings workspace of the desired analysis. rca/shell/<EntityKey>/track: Displays the Track workspace of the desired analysis. rca/shell/<EntityKey>/reports: Displays the Reports workspace of the desired analysis. | |||
| <EntityKey> | Specifies the analysis that you want to view. |
The Entity Key of the desired analysis. |
This parameter is required and refers to the analysis. Without the Entity Key, the URL will not be supported. |
Example URLs
| Example URL | Destination |
|---|---|
| rca/dashboard/0 | Opens the Root Cause Analysis dashboard at the home level of the asset hierarchy. |
|
rca/shell/2842234/mainrca | Opens the Analysis Summary workspace for the Entity Key 2842234. |
|
rca/shell/2842234/preserverecord | Opens the Preserve Records workspace for the Entity Key 2842234. |
| rca/shell/2842234/ediag | Opens the Event Diagram workspace for the Entity Key 2842234. |
|
rca/shell/2842234/ltree | Opens the Logic Tree workspace for the Entity Key 2842234. |
| rca/shell/2842234/cfindings | Opens the Communicate Findings workspace for the Entity Key 2842234. |
|
rca/shell/2842234/track | Opens the Track workspace for the Entity Key 2842234. |
|
rca/shell/2842234/reports | Opens the Reports workspace for the Entity Key 2842234. |
System Code Tables Used by Root Cause Analysis
The following table lists the System Code Tables that are used by Root Cause Analysis.
|
Table ID |
Table Description |
Function |
|---|---|---|
| MI_RCA_BUSINESS_IMPACT | Business Impact | Populates the Business Impact field in the General Information section of the RCA Recommendation datasheet. |
| MI_RCA_HYPOTHESIS_CONFIDENCE_FACTORS | Hypothesis Confidence Factors | Populates the Confidence Factor field in the Hypothesis Details section of the RCA Hypothesis datasheet. |
| MI_RCA_REFERENCES | RCA Recommendation Status | Populates the Status field in the General Information section of the RCA Recommendation datasheet. |
| RCA Analysis Type | RCA Analysis Type | Populates the Analysis Type field in the Analysis Details section of the RCA Analysis Detail datasheet. |
| RCA Hypothesis State | RCA Hypothesis State | Populates the State field in the Hypothesis Details section of the RCA Hypothesis datasheet. |
| RCA Team Member Type | RCA Team Member Type | Populates the Member Type field in the Team Member Details section of the RCA Team Members datasheet. |