Overview
Production Loss Analysis (PLA) Overview
The GE Digital APM Production Loss Analysis (PLA) module allows you to compare actual production to planned production. PLA enables you to uncover any minor or major factors causing loss in production. Minor factors are often missed because the focus is on more obvious factors.
PLA allows you to:
- Enter production data.
- Identify production losses and associate them with the events that caused them.
- Determine what types or categories of events cause your company to lose the most production.
By entering and evaluating production data, you can more easily identify ways in which you can reduce unplanned downtime and increase production in the future, which will result in reduced cost and increased profit.
More Details
Consider the following graph, which represents a company's optimal, planned, and actual production percentage for a year.
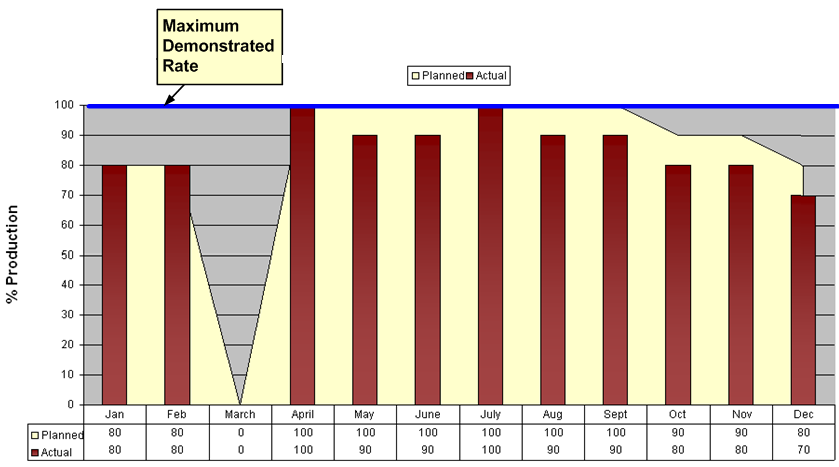
In this graph, you can see from the blue line that the maximum demonstrated rate, or the percentage of output the company can produce during optimal operating conditions, is 100%.
The yellow area displays the planned production percentage for each month. Because the managers know that they cannot produce 100% of this maximum output each month, the planned production rate is lower than 100% during some months. In March, the planned production rate is 0% because the company plans to shut down that month to perform maintenance, install new equipment, and so on.
The red bars indicate the actual production rate each month. You can see that, in some months, the company produced the amount they planned, and, in other months, they produced less than they had planned.
From this graph, managers might conclude that more than half of their lost production for the year was due to the shutdown in March. If they could find a way to reduce this shutdown time or eliminate it completely, they would see a great increase in overall production.
Based on other data entered using PLA, managers would also be able to determine exactly how much money they lost during the March shutdown and how much money they lost during other months in which they did not reach the 100% production rate. They could then categorize these losses into planned and unplanned losses.
Access the PLA Overview Page
About this task
This topic describes how to access the PLA Overview page, on which you can view all the information and perform tasks related to the production of various hierarchy levels.
Procedure
The PLA Overview page appears.
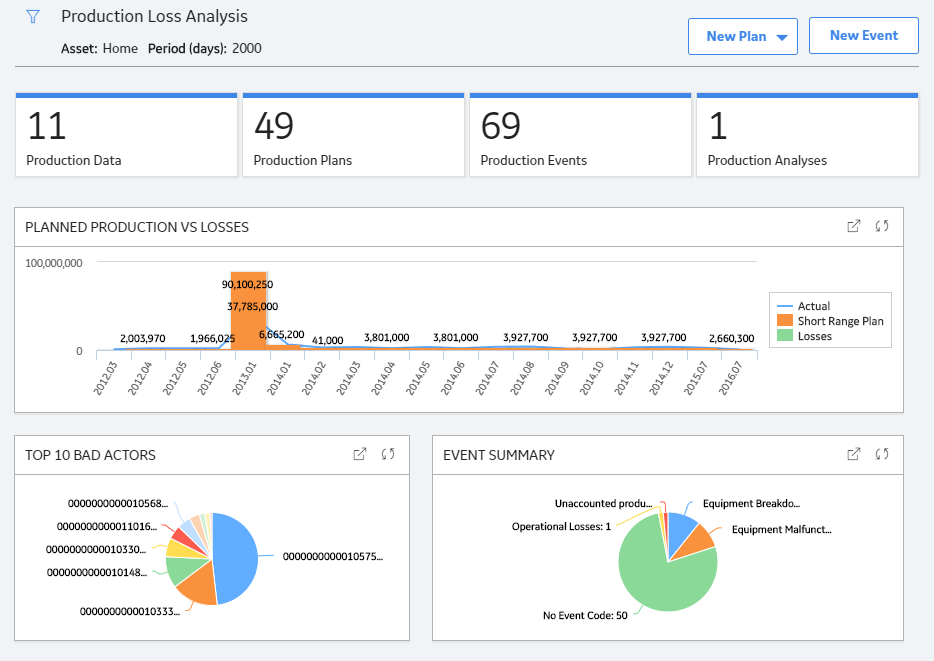
The tabs at the top of the page summarize the number of items in each category. You can select a tab to view one of the following lists:
-
Production Data: Contains a list of Production Plans that contain incomplete Production Data.
Note: The number on the Production Data tab only includes Production Plans that are in progress. Production Losses do not have to be reconciled for Production Data to be considered complete. - Production Plans: Contains a list of all Production Plans available in the GE Digital APM database.
- Production Events: Contains a list of Production Events available in the GE Digital APM database and allows you to create new Production Events.
- Production Analyses: Contains a list of Production Analyses, which are created in the PLA module.
On the page, you can also view the following sections:
- Planned Production vs Losses
: Plots the planned production, actual production, and losses for given time period. By default, this chart shows values for last 90 days. You can select
 on the upper-left corner of the PLA Overview page to modify the time period to 120 days or 365 days.
 In the chart:
- The line representing Actual shows the number of units that were produced for a specific month. The horizontal axis (X) represents months. You can select a datapoint to view the total number of units produced in that month.
- The bars representing Short Range Plans show the number of units that were planned to be produced for the specific month. You can select a bar to view the total number of units planned to be produced in a month and number of the month for which you are viewing the planned production.
- The bars representing Losses show the amount of production (in number of units) that was lost. You can select a bar to view the total losses for a month and number of the month for which you are viewing the losses.
While viewing the chart, you can select
 in the upper-right corner of the chart to modify the appearance of the plot using standard graph features.
 - Top 10 Bad Actors: Contains a chart that plots the total cost of losses that were contributed by the top 10 bad actors within a selected hierarchy level for a given time period. The losses represented here are the total amount of production lost for the affected plans, products, and units. By default, this chart shows values for last 90 days. You can select on the upper-left corner of the PLA Overview page to modify the time period to 120 days or 365 days.
- Event Summary: Contains a chart that plots the count of Production Events filtered by the Event Code percentage for a given time period. By default, this chart shows values for last 90 days. You can select on the upper-left corner of the PLA Overview page to modify the time period to 120 days or 365 days. You can select a datapoint for a Production Event to view:
- The Event Code
- The count of each Event Code
PLA Workflow
This workflow provides the basic, high-level steps for using PLA. The steps and links in this workflow do not necessarily reference every possible procedure.
- For each production unit, create a production plan to specify the amount of product you plan to produce during a set time period. You can create the plan on any schedule, such as yearly, quarterly, monthly, and so on.
- If an event such as an equipment failure or a planned shutdown occurs and causes you to incur a production loss, document the event.
- Enter production data on a daily basis. This includes entering the amount of product that you produced and accounting for any losses that you incurred each day.