 Plant Applications
Analyze a Batch
You can use the Analysis application to analyze a batch, compare the batch with the other batches, navigate to previous and next batches, and compare how the variables associated with the batch produced trend over the batch duration. The ANSI/ISA–88.01–1995 documentation defines a batch as the material that is being produced or that has been produced by a single execution of a batch process or an entity that represents the production of a material at any point in the process. Batches are produced on a single equipment or a process cell. A golden batch is a batch that is identified to be used as a reference batch for a few specific KPIs such as the best yield, lowest waste, best quality, and higher productivity.
Procedure
- Log in to the Plant Applications Web Client.
- Select
 .
.
The Chart Configuration page appears.
Note: After you login and select for the first time, the default trend chart appears. You can select  to go back to the Chart Configuration page.
 - In the Plant Model list, select a plant model associated with the batch.
- In the Data type list, select Batches.Note: The Batches and Golden Batches options appear only when the Plant Applications Web Client is configured to use batches instead of process orders.
- Search for the batch that you want to analyze, and then, in the Batches section, select Add Batches.Tip: You can add multiple normal batches or golden batches to compare their details. For more information, refer to the Add Tags, Variables, KPIs, Process Orders, and Batches topic.
- Select Plot to access the CHART CONTROLS page, and then analyze the batch.Tip: Alternatively, you can select
 to access the CHART CONTROLS page.
By default, the CHART CONTROLS page appears in Normal View, displaying a Gantt chart for the selected batch. If you selected only one batch, the batches available within the five days before and after the selected batch also appears in the chart. You can hover over a batch to view its details. For more information about trend charts, refer to the Types of Trend Charts topic.
In the CHART CONTROLS page, you can use the Toggle View option to toggle between the interval and duration modes.
- Analyze the selected batch with respect to variables in a Line chart by following these steps:
- Select to return to the Chart Configuration page.
- In the Data type list, select Variables.
- Search for the variables you want to plot in the Line chart, then select Add Chart, and then select Plot to plot the selected variables for the selected batch in a single Line chart.Tip: Select Add Chart to add more charts and plot a single variable or a combination of variables in different charts.
In the CHART CONTROLS page, the Line chart appears in the CHART 2 section after the Gantt chart as shown in the following image.
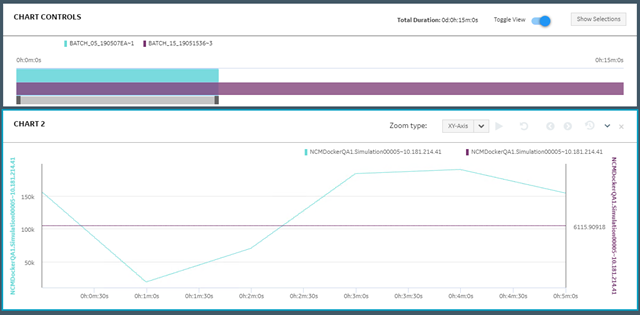
You can set the time slider bar for the required time duration for the process order. When you update the time duration for the process order in the Gantt chart, the application updates the corresponding Line chart displaying the time series data. In addition, the application synchronizes the horizontal axis for the Gantt and Line charts.
- Select