 Plant Applications
Analyze a Process Order
About this task
You can use the Analysis application to analyze one or more Process Orders when Plant Applications is configured to use process orders instead of batches. In some organizations, a batch is identified as a process order number. In this scenario, the process order quantity is the batch quantity produced in a production run.
Procedure
- Log in to the Plant Applications Web Client.
- Select
 .
. The Chart Configuration page appears.
Note: After you login and select for the first time, the default trend chart appears. You can select  to go back to the Chart Configuration page.
 - In the Plant Model list, select a plant model associated with the process order.
- In the Data type list, select Process Orders.Note: The Process Orders option appears only when the Plant Applications Web Client is configured to use process orders instead of batches.
- Search for the process order that you want to analyze, and then, in the Process Orders section, select Add Process Orders.Tip: You can add multiple process orders to compare their details.
- Select Plot to access the CHART CONTROLS page, and then analyze the process order.Tip: Alternatively, you can select
 to access the CHART CONTROLS page.
By default, the CHART CONTROLS page appears in Normal View and a Gantt chart appears for the selected process order.
If you selected only one process order, the process order available in the five days before and after the selected process order also appears in the chart. You can hover over a process order to view its details. For more information about trend charts, refer to the Types of Trend Charts topic.
In the CHART CONTROLS page, you can use the Toggle View option to toggle between the interval and duration modes.
If you selected multiple process orders, then the Gantt chart appears in the duration mode only.
- Analyze the selected process order with respect to variables in a Line chart by following these steps:
- Select to go back to the Chart Configuration page.
- In the Data type list, select Variables.
- Search for the variables you want to plot in the Line chart, then select Add Chart, and then select Plot to plot the selected variables for the selected process order in a single Line chart.Tip: Select Add Chart to add more charts and plot a single variable or a combination of variables in different charts.
In the CHART CONTROLS page, the Line chart appears in the CHART 2 section after the Gantt chart as shown in the following image.
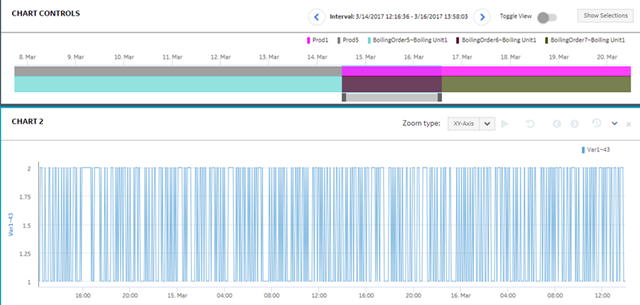
You can set the time slider bar for the required time duration for the process order. When you update the time duration for the process order in the Gantt chart, the application updates the corresponding Line chart displaying the time series data. In addition, the application synchronizes the horizontal axis for the Gantt and Line charts.
- Select