 Plant Applications
Types of Trend Charts
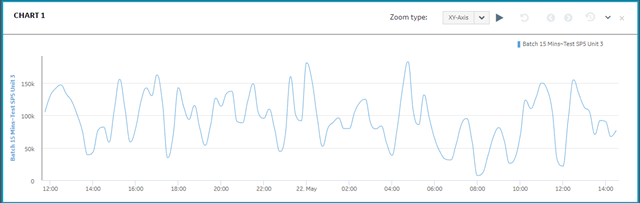
Trend charts are graphical representations for showing how the value of one or more items changes over time.
Line is the default type of chart.


Have You Seen Plant Applications Lately? Click here to check out all the new features in the latest version.
Supercharge your GE solution! Download a free trial of Proficy Operations Hub, CSense analytics, and more. Learn more about the Proficy 2023 releases, by signing up for one of our upcoming events.
Trend charts are graphical representations for showing how the value of one or more items changes over time.
Line is the default type of chart.