 Plant Applications
About Reports
As a supervisor, you can generate OEE and production status reports for selected assets, displayed as a series of cards.
The Reports application enables you to generate OEE and production status reports for selected assets, displayed as a series of cards. You can access the KPI reports and production status of the plant by Department, Production Line, and Production Unit. The application also provides information about Planned vs. Actuals for each KPI.
OEE is derived as a product of the following metrics:
When reporting OEE statistics, the following thresholds apply:
| Good | > 85 percent |
| Moderate | > 50 percent and <= 85 percent |
| Low | <= 50 percent |
The production status report provides data related to tracking of products and order-completion status (scheduled for production, in progress, or completed).
In the Reports application, in the Show list, you can select one of the following options to generate the corresponding report type:
- Product OEE: Displays the OEE report for a product. You can expand a row in the search results to compare planned versus actual KPI data for the product as shown in the following image.
Figure 1. Product OEE Report 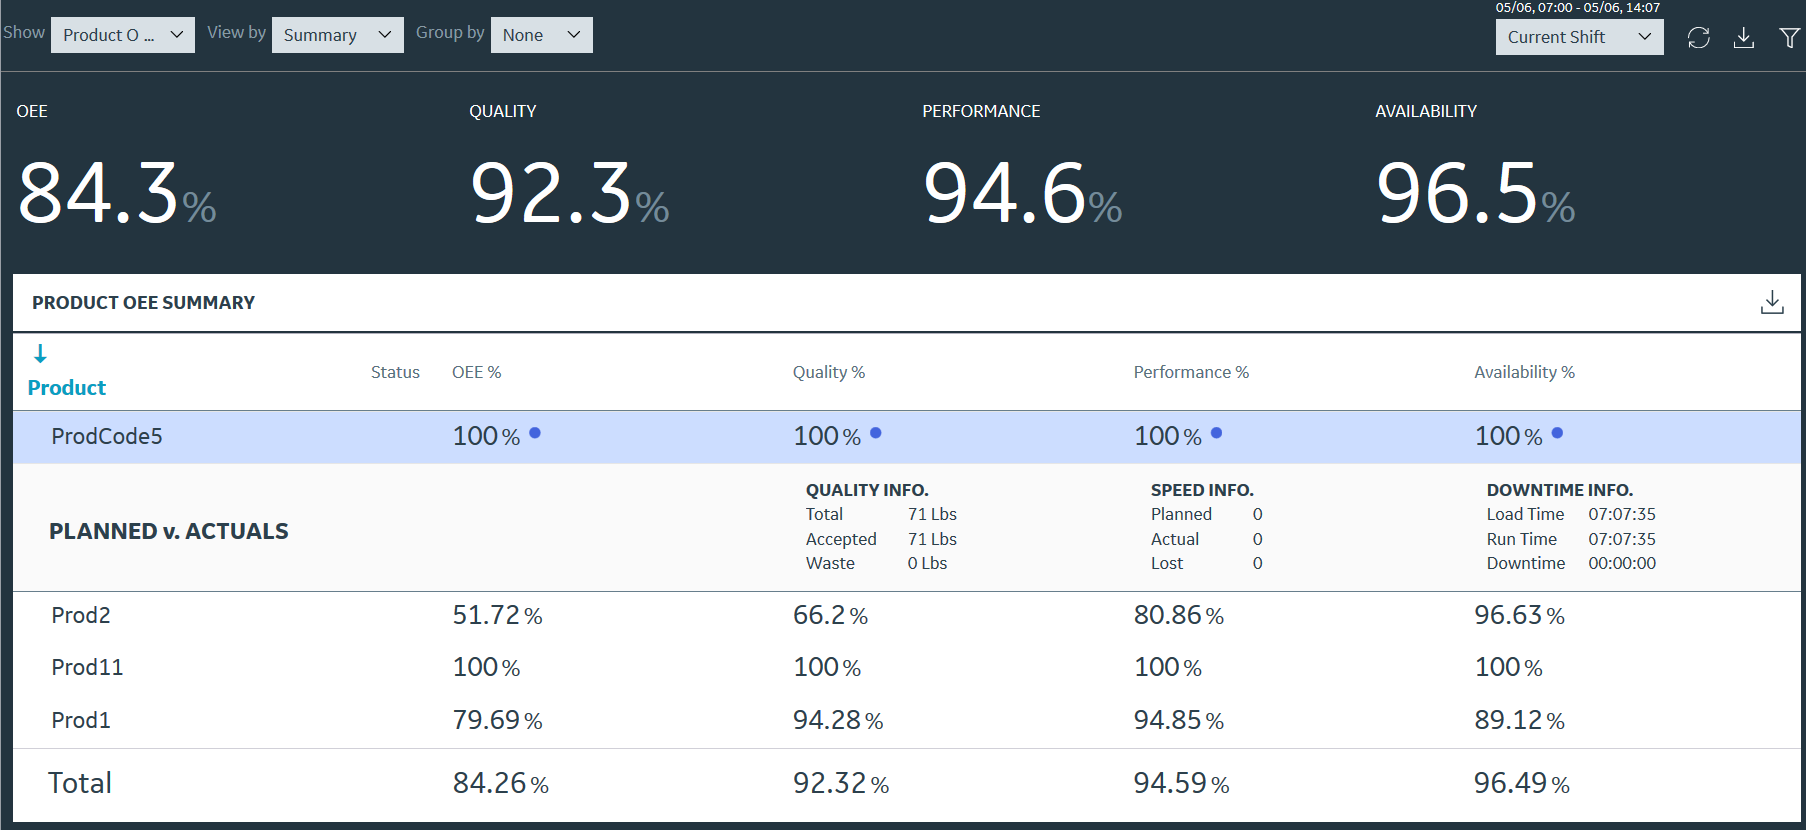
- Order OEE: Displays the OEE report for an order. You can expand a row in the search results to compare planned versus actual KPI data for the order as shown in the following image.
Figure 2. Order OEE Report 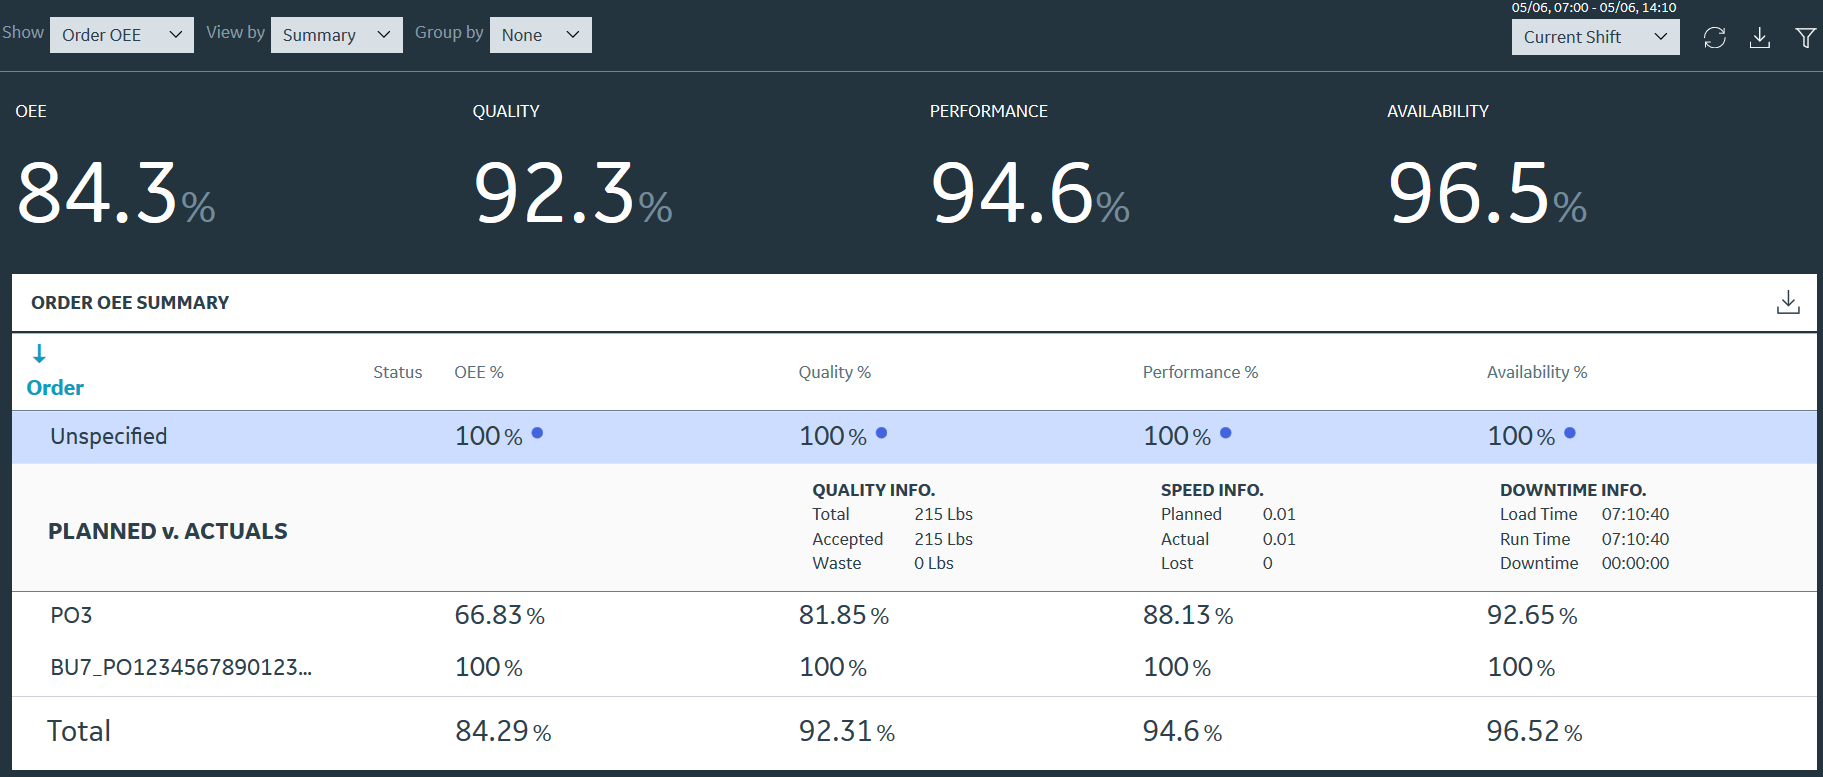
- Production Status: Displays the status of an order in a shift. You can expand a row in the search results to access more information about the order as shown in the following image.
Figure 3. Production Status Report 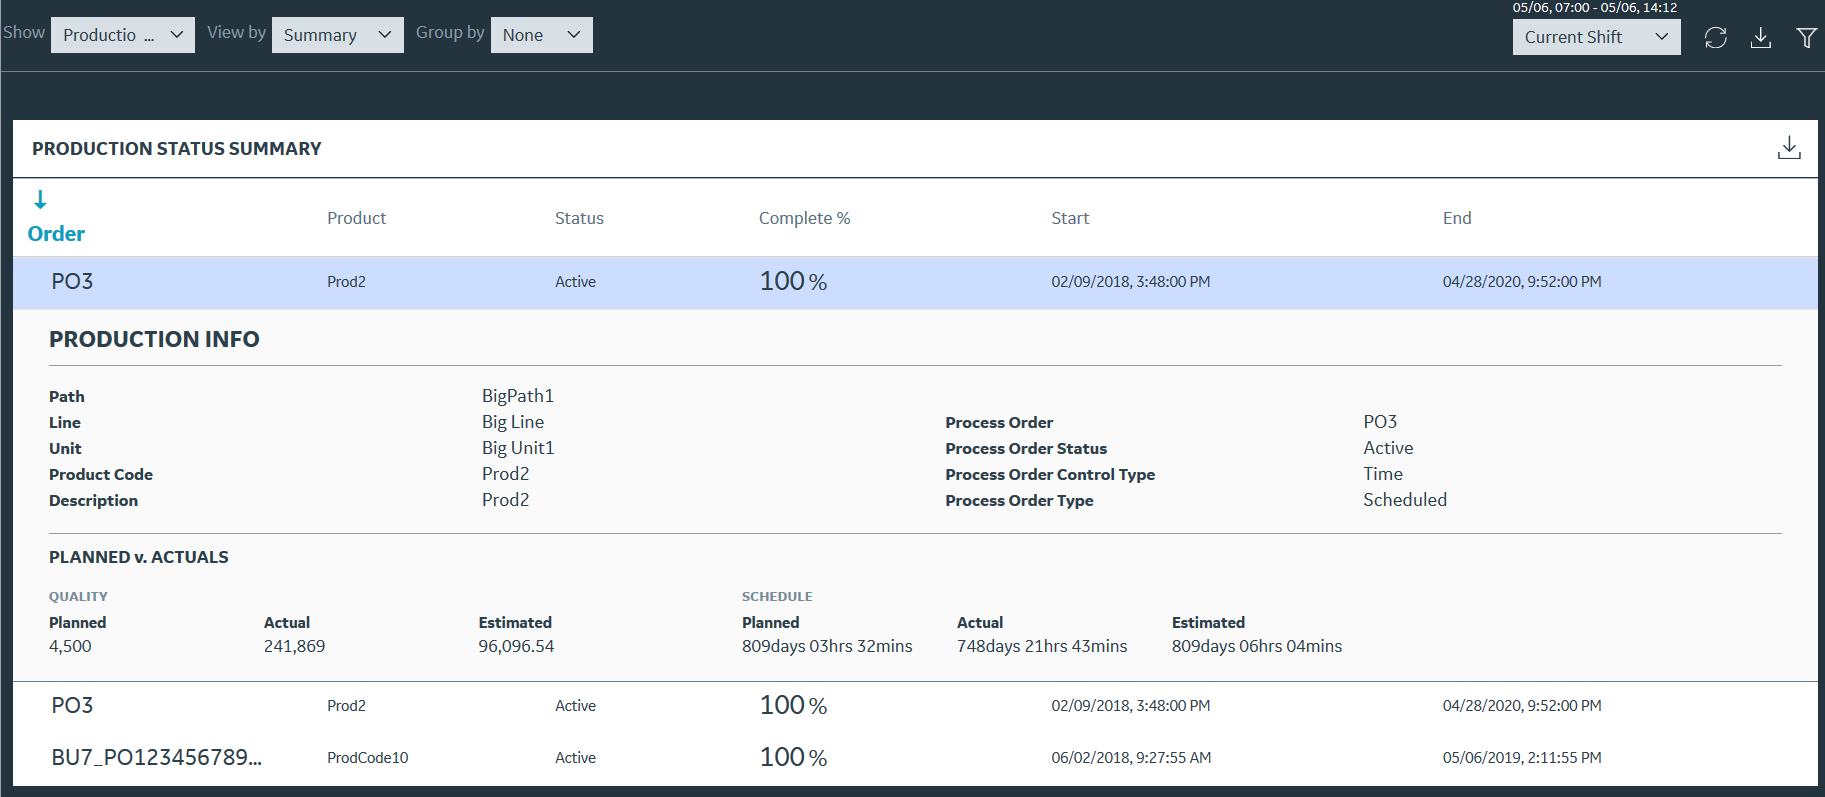
You can select  , select the NPT check box, and then select Apply to include any non-productive time (NPT) in these reports. For more information, refer to the About Non-Productive Time in Downtime Calculations topic.