 Plant Applications
Access Closed Orders
About this task
Procedure
- Log in to Plant Applications Web Client.
- Select
 . By default, the Open page appears, displaying a list of process orders grouped based on the multiple execution paths (configured in Plant Applications Administrator) in a tabular format. The process orders are sorted based on their actual end date, actual start time, or entry on (modified) value.
 - Select the Closed tab to access all the process orders that were completed, cancelled, over produced, under produced, and error process orders. In the table displaying the list of closed orders and their details, you can resize a column or drag and drop a column to a new position. The column settings you select in the table are retained when you access the Closed page later.
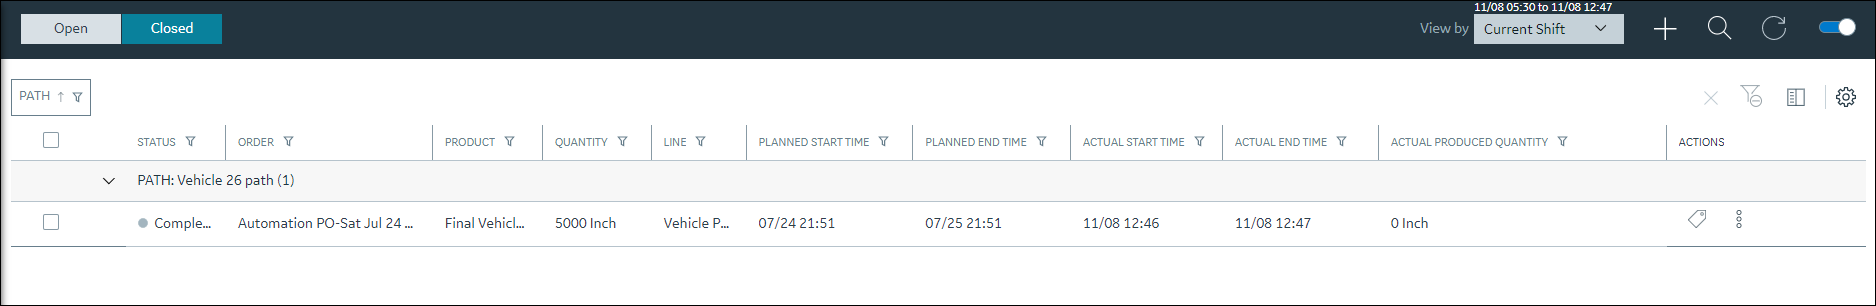 In addition, the following information appears in a tabular format for each process order.
Option Action STATUS The process order status along with the corresponding color. - Grey: Complete or Cancelled
- Red: Error, Underproduced, or Overproduced
ORDER The unique process order number. LINE The production line description. PRODUCT The product associated with the process order. QUANTITY The planned quantity for the process order. PLANNED START TIME The date and time when the process order was planned to begin. The date and time appear in the following format: mm/dd hh:mm (for example, 03/27 10:58). PLANNED END TIME The date and time when the process order was planned to end. The date and time format is driven by localization setting. For example: mm/dd hh:mm or dd/mm hh:mm ACTUAL START TIME The actual start date and time of the process order. The date and time format is driven by localization setting. For example: mm/dd hh:mm or dd/mm hh:mm ACTUAL END TIME The actual end date and time of the process order. The date and time format is driven by localization setting. For example: mm/dd hh:mm or dd/mm hh:mm. ACTIONS The actions that you can perform on a process order. You can select one of the following action items:  : Select to change the status of process order.
 : Select to edit, comment, or delete a process order.
ACTUAL PRODUCED QUANTITY The actual produced quantity for the closed process order. - In the View by drop-down list box containing the time range options, select a time range as described in the following table. The range that you select appears in the form of date and time interval next to the drop-down list box containing the time range options.
Option Description Last <number> Hours Select to access all closed process orders within <number> hours prior to the current Production time. The value of <number> is configured in Plant Applications Web Client using the property "lastNHours" in the apps.properties.json file. Previous Day Select to access all closed process orders from the day prior to the current Production Day. Current Day Select to access all closed process orders from the start time until the end time of the current Production Day. If there are no shifts configured for the plant, this option is selected by default. Current Shift Select to access all closed process orders from the start time until the end time of the ongoing shift. If shifts are configured for the plant, this option is selected by default. Previous Shift Select to access all closed process orders from the shift prior to the current shift. Last 7 days Select to access all closed process orders within seven days prior to the current Production Day. Custom Select to access all closed process orders within a date and time range of up to seven days that you specify by using a calendar window. The following calendar window appears when you select the Custom option.
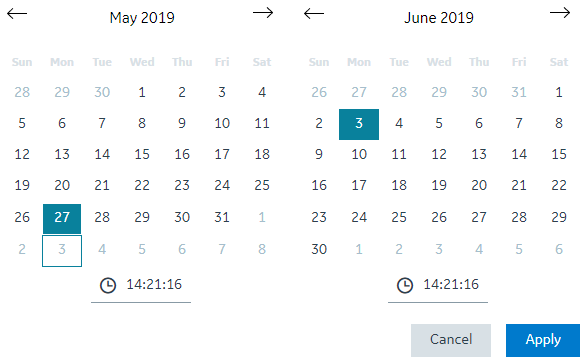 To specify a custom date and time range in the calendar window:
- In the START DATETIME section, select a date and enter a time in the format hh:mm:ss.
- In the END DATETIME section, select a date and enter a time in the format hh:mm:ss.Note: The end date must be within seven days of the start date.
- Select Apply.
Note: The Previous Shift and Current Shift options appear only when shifts are defined for the display in Plant Applications Administrator.The list of closed process orders appear based on the time range selected.Note: The list of closed process orders displayed is refreshed based on the refreshNMinutesDuration set in the apps.properties.json file.- For docker-based installation, the apps.properties.json file is located at <installation_directory>/PlantApplicationsDocker/plantapps-universal-client/production-scheduler-app
- For standard installation, the apps.properties.json file is located at C:\Program Files\GE Digital\PlantApplicationsWebClient\NodeUIApp\<application name>\assets.
For example: If the refreshNMinutesDuration is set to 5 minutes and the user does not interact with the UI for a duration greater than or equal to 5 minutes, the list gets refreshed and the timestamp is updated accordingly.
- Optional: In the table displaying the list of process orders and their details, select an option to perform an action as described in the following table.
Option Description 
Select to Add a New Process Order. 
Select to update the process orders list with the latest information. Note:This icon is enabled only when there are updates to the process orders list. Else, one of the following icon appears:-
 : Indicates that there are no updates to the process orders list.
  : Indicates that there are additional open process orders available. Select to refresh the page and access all the open process orders.
-
 : Indicates that the RabbitMQ service is down.

Select to automatically update the process orders. You can disable this, if you do not want to update only the newly added process orders. PATH 
Select to filter the process orders based on the selected path. Select a check box(es), and then select Apply to include the process orders the are grouped by selected paths in the results. 
Select to delete multiple process orders. Note: This icon is enabled only when you select the check boxes for one or more process orders in the table.
Select to add or remove columns from the table displaying the process orders list. The added columns are retrieved when you access the Open page later. By default, the following columns appear in the specified order when you access the Open page:- STATUS
- ORDER
- PRODUCT
- QUANTITY
- LINE
- PLANNED START TIME
- PLANNED END TIME
- ACTUAL START TIME
- ACTUAL END TIME
- ACTUAL PRODUCED QUANTITY
- ACTIONS
Tip: You can use the horizontal scroll bar in the table to drag the scroll box and access the data from all the added columns. -