 Web HMI
View Alarm Cards
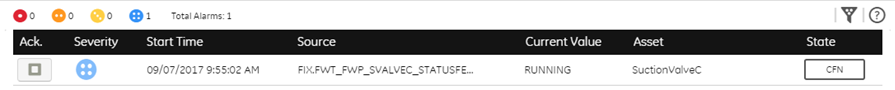
An Alarm Card provides details of the active alarms by their severity levels in the HMI/SCADA system for the selected asset. You can acknowledge alarms and apply filters to display specific information about alarms.
The severity of an alarm is based on the priorities set in the underlaying HMI/SCADA system. Each alarm icon is color-coded and contains a specific number of dots to indicate its severity level, as shown in the following table. Each icon has a corresponding number to indicate the number of alarms currently active for that severity level. The UI banner shows the number of alarms per severity level for all assets in the model, whereas the Alarm Card displays the number of alarms per severity level for the selected context.
| Icon | Description |
|---|---|
| Alarm is critical. | |
| Alarm is high priority. | |
| Alarm is medium priority. | |
| Alarm is low priority. |
Note: When Web HMI cannot connect to one or more alarm sources, the connection status icon appears orange on the Alarm Card. Hover over  to see which alarm sources are not connected. This icon becomes red when Web HMI cannot connect to ANY alarm sources, and these sources are not listed in the tooltip.
- Select
 , the Asset Context Selector, to choose your context.This displays the relevant data in context to each asset selected in the navigation scheme.
 - Select
 , the Alarm Card icon.The Alarm Card displays the alarms for that asset and its descendants’ assets.
 - Optional: To view data in a column in ascending or descending order, select the heading column name.
- Optional: To define specific column criteria for viewing alarms in the table, such as displaying only critical alarms, select
 and set the criteria accordingly.Filters do not persist after you close your browser.
 - Optional: To acknowledge an alarm, do the following: