 Web HMI
Manipulate Trend Charts
You can pause live data flow, display areas outside the area you are currently viewing, and use various zoom options to view and analyze trends on live and historical charts.
- Click anywhere in a live chart to pause its data flow while it still collects data. The following shows a paused chart, indicated by a line through the
 icon.
icon. 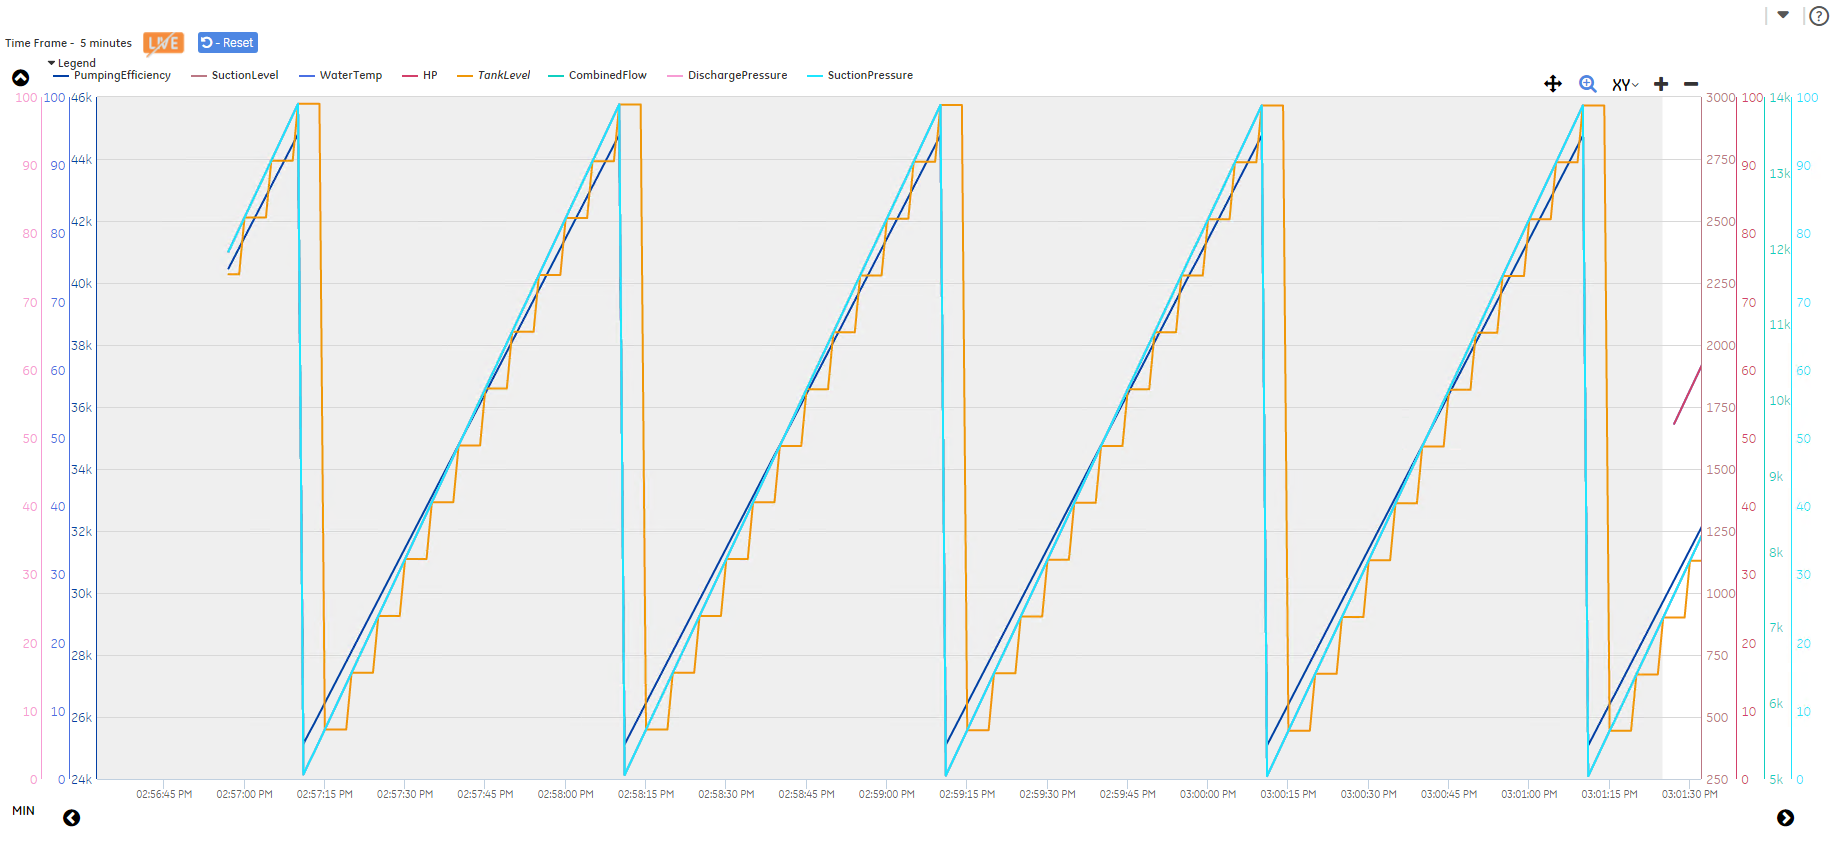
- Use the following zoom options to get a closer look at trend values:
- To zoom in and out on the center of a chart (both XY axes), use + and - on the toolbar.
- To view a specific area on the chart, hover over the chart with the
 cursor, and then click and drag to form a box over that area.
 - To isolate an axis for zooming, select XY on the toolbar, and then select X or Y from the drop-down list. When you zoom on the y-axis, the chart remains in live mode with data flowing.
- Use the following pan options to adjust the chart axis for viewing:
- Select
 from the toolbar, and click and drag to view different values and time periods on the chart.
- Select
- Optional: Select the arrow next to Legend to show or hide the data variables of the selected asset.In the smaller view of the Trend chart, these variables are hidden by default.
- Optional: To use the y-axis line toggle:
- Select a variable name in the legend and its name becomes italicized and its y-axis line disappears.
- Select the italicized variable name and its name becomes grayed out and its trend line disappears.
- Select the grayed-out variable name and its y-axis line and trend line reappear.
In the smaller Trend chart view, the y-axis does not appear by default, as shown in the following example. To show the y-axis, select the arrow next to Legend, and then select the data variable to display.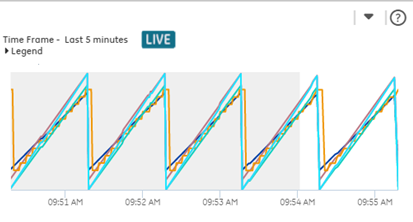
- After making changes to a chart, select
 to revert the chart to its original duration and axis preferences.This is the best way to return to live mode after manipulating the chart. You can also return to live mode by using the right pan arrow to shift to the current time.