 Web HMI
View Trend Cards
Trend Cards provide a trend-line analysis view of selected data variables for an asset within a selected time period. Trend Card charts can display both real-time and historical data.
Note: Boolean and string tags from real-time data sources are not supported in the Trend Card.
- Select
 , the Asset Context Selector, to choose your context.This displays the relevant data in context to each asset selected in the navigation scheme.
 - Select
 , the Trend icon.
 - Select the down arrow at the top right of the Trend Card. The TREND CONFIGURATION window appears showing the time settings as well as the asset's data variables with their associated data source type icons, as shown in the following example. The
 icon represents a historical data source and the
  icon indicates a real-time data source.
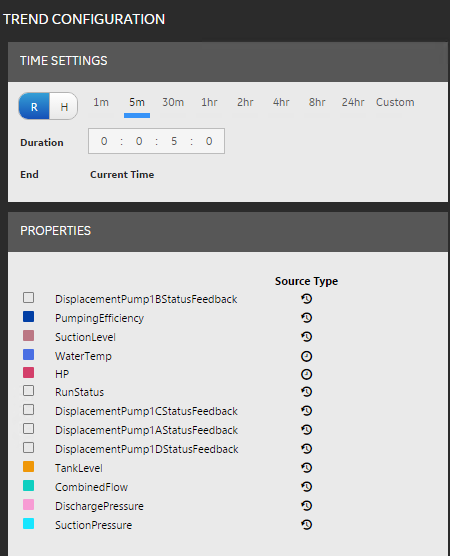
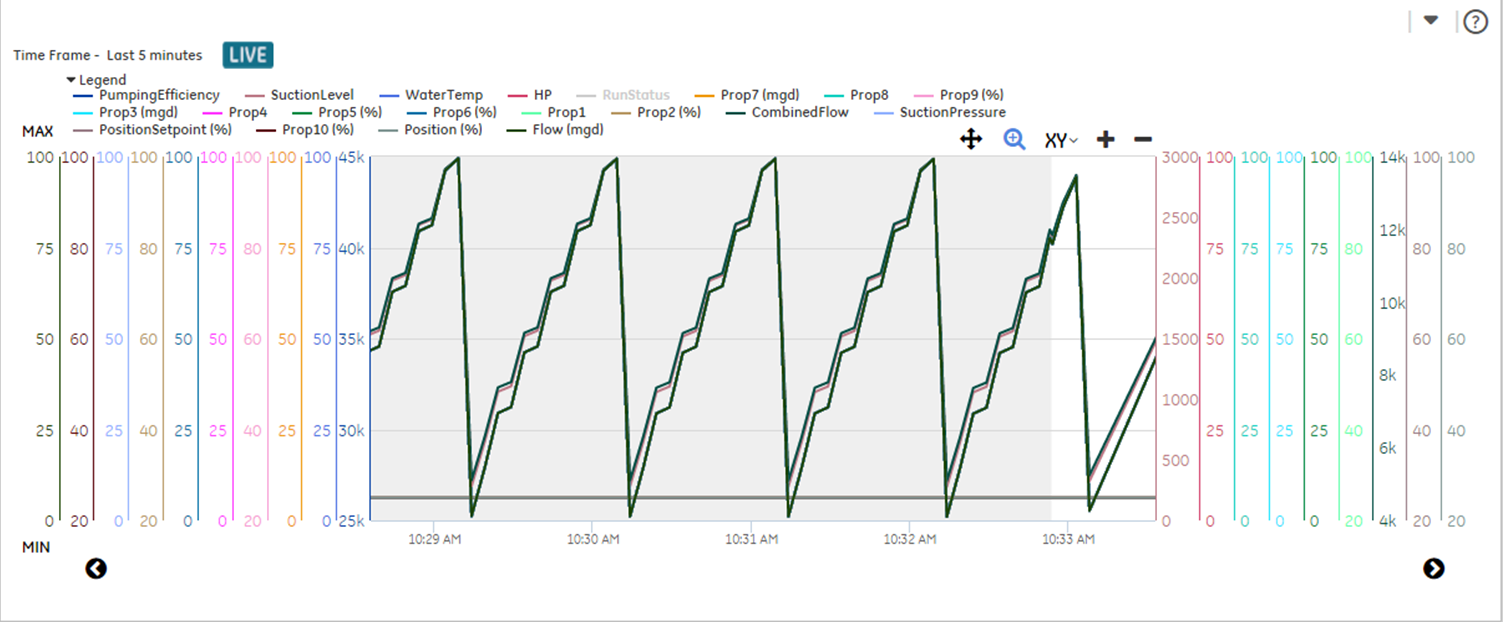
- Select Real-time (R) or Historical (H). In the Real-time (R) view, you can see both real-time and historical data that is charted from the current time. The initial view shows a gray background, indicating the time period before opening the Trend Card. Only values coming from historical data sources will appear during this time frame. Subsequent real-time data appears with a white background, as shown in the following chart. In the Historical (H) view, you can see historical data charted on a start time and a duration.
- To view real-time trend data, do the following:
- To view historical trend data, do the following: