 Plant Applications
Access KPIs
About this task
Procedure
- Log in to the Plant Applications Web Client.
- Select
 .The Events page appears.
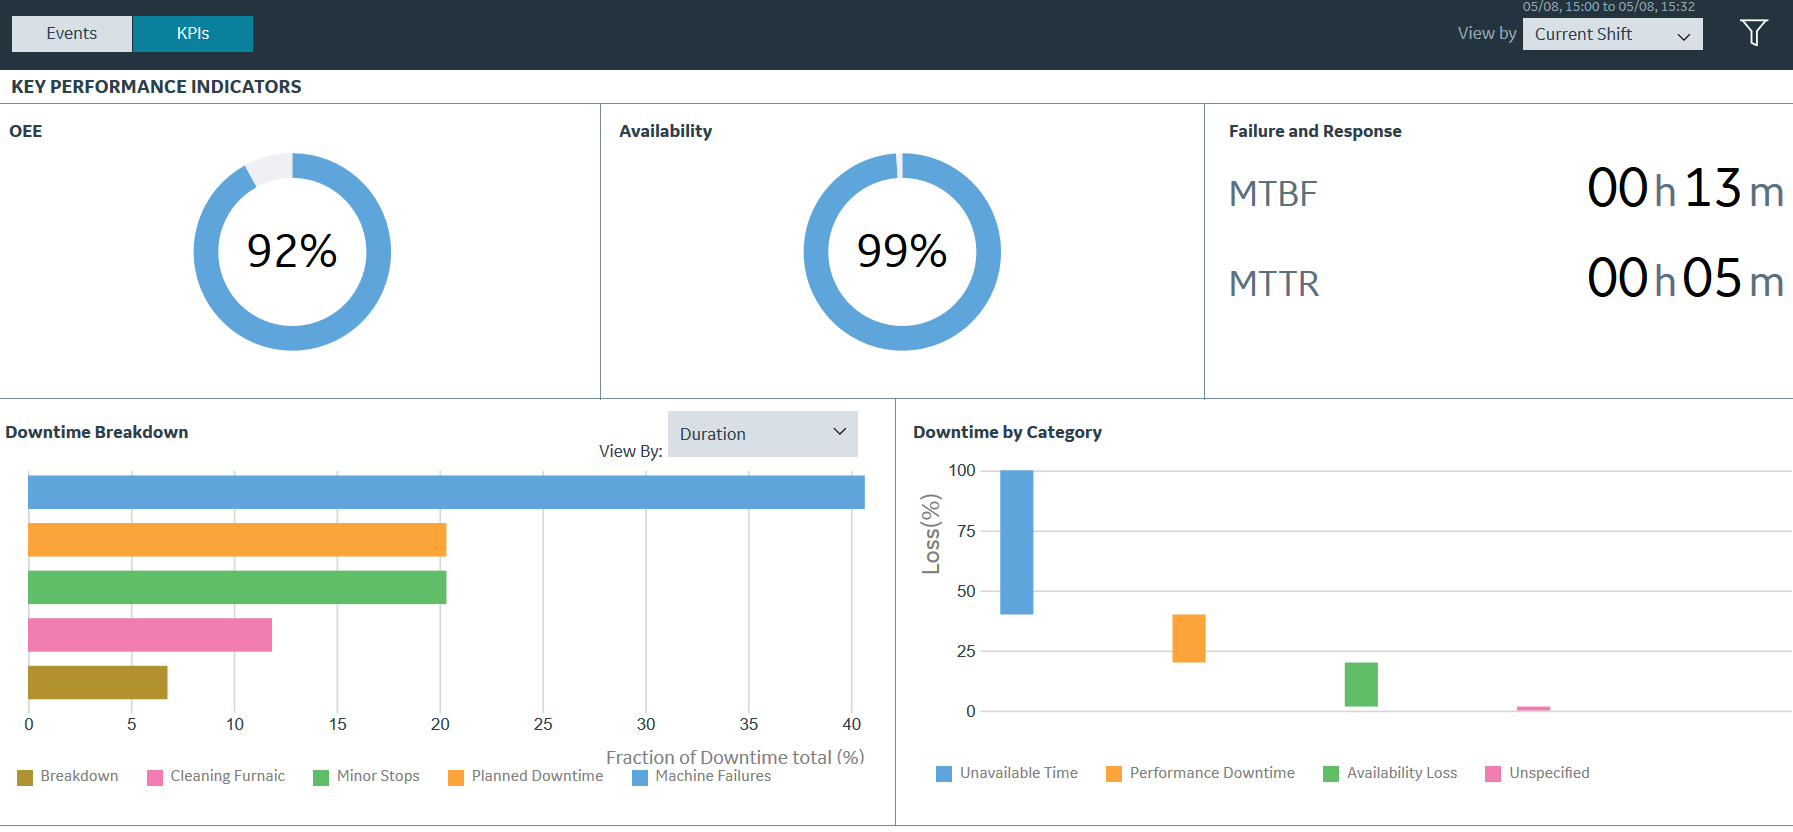
 - Select the KPIs tab.The Donut chart appears in the dashboard summarizing the OEE and availability of the equipment. Each KPI shows the following status information.
Status Colors Range Good Blue > 85 percent Moderate Yellow > 50 percent and <= 85 percent Low Red <= 50 percent Note: The maximum value for the KPIs are set to 100% by default. However, you can override this by setting OEE Max Limit Override to true. The OEE Max Limit Override flag allows the OEE cap beyond 100%. When this flag is set to false and the KPI actual value is more than 100%, the value is defaulted to 100% in the chart.The time duration for MTBF and MTTR values appears in hours and minutes.
 Note: These KPI metrics are based on the OEE Aggregation Store setting. If OEE Aggregation Store is set to False, the values are calculated on the fly every time the chart is opened or refreshed. If it is set to True, the values are populated from the OEE Aggregation tables. For more information, refer to the OEE Aggregation Store topic.
 - In the drop-down list box containing the time range options, select a time range as described in the following table.
Time Range Description Last <number> Hours Select to access all KPIs within <number> hours prior to the current Production Day. The value of <number> is configured in Plant Applications Administrator. Previous Day Select to access all KPIs from the day prior to the current Production Day. Current Day Select to access all KPIs from the start time of the current Production Day until the current time. If there are no shifts configured for the plant, this option is selected by default. Current Shift Select to access all KPIs from the start time of the ongoing shift until the current time. If shifts are configured for the plant, this option is selected by default. Previous Shift Select to access all KPIs from the shift prior to the current shift. Last 7 days Select to access all KPIs within seven days prior to the current Production Day. Custom Select to access all KPIs within a date and time range that you specify by using a calendar window. The following calendar window appears when you select the Custom option.
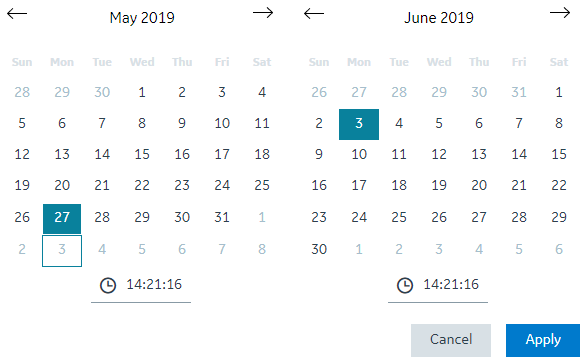 To specify a custom date and time range in the calendar window:
- In the START DATETIME section, select a date and enter a time in the format hh:mm:ss.
- In the END DATETIME section, select a date and enter a time in the format hh:mm:ss.
- Select Apply.
- Optional: Select
 , then select the NPT check box, and then select Apply to include any non-productive time (NPT) in the results. For more information, refer to the About Non-Productive Time in Downtime Calculations topic.
 - In the Downtime Breakdown section, in the View By box, select Duration or Count to access downtime events. You can access the loss percentage and reasons for the downtime events in the Downtime by Category chart.