 CIMPLICITY
9. SPC Control: Annotation
SPC enables users whose role has been assigned access to enter comments (annotations) about one or more values that display on the charts.
The SPC Control Properties dialog box>Annotation tab enables you to specify colors that can help users quickly see what subgroups have annotations
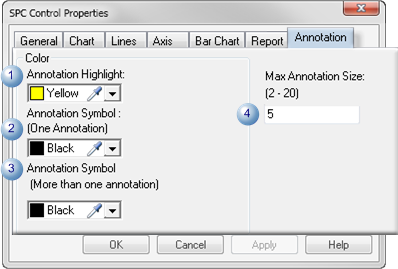
| 1 | Annotation Highlight | The subgroup that represents the value on the SPC chart displays the Annotation highlight color when that subgroup is selected to display its existing annotations or to be assigned a new annotation. | |
| 2 | Annotation Symbol: One annotation | A light weight circle will display around subgroups that have one annotation; the circle will display in the selected color. | |
| 3 | Annotation Symbol: More than one annotation | A heavy weight circle will display around subgroups that have two or more annotations; the circle will display in the selected color. | |
| 4 | Max Annotation Size | Each subgroup value on a chart can have the maximum number of annotations specified in the Max Annotation Size field. The maximum number can be 2 through 20 annotations. | |
| Default | 5 | ||
| Note: If a user attempts to enter more than the specified number of annotations, a message will open to explain that the limit was exceeded. | |||


