CIMPLICITY
5.1. SPC Annotation: Values Selected
About this task
Note: The chart pauses while it is in annotation mode. Values that can be selected include.
- Individual values.
- Group of values.
Individual Values
Individual values can be selected for a list of annotation ready and annotation items.
Procedure
-
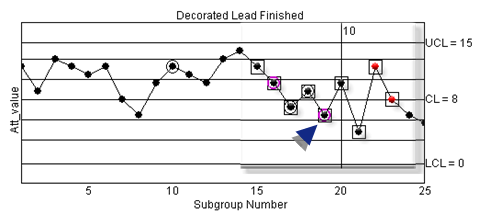
Double-click one or more values on the SPC chart.
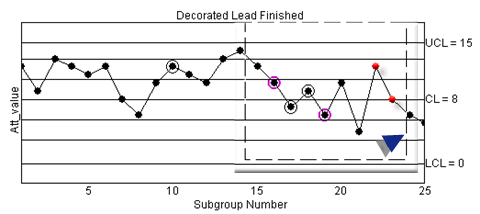
A box displays around selected values indicating that they will be listed in the Annotation Viewer.
Subgroups that display the following symbols are or have been included in an annotation session as follows.

Symbol Description Subgroup 
Annotation highlight. Is selected for immediate annotation in the Annotation Viewer. Note: The subgroup displays a unique color. 
Annotation symbol: One annotation. Has one annotation. 
Annotation symbol: More than one annotation. Has more than one annotation 
Box surrounding subgroup. Is selected to be listed currently in the Annotation Viewer. Note: Guidelines- Single-click any box to remove the subgroup from being listed in the Annotation Viewer.
- Colors can be selected on the SPC Control Properties dialog box>Annotation tab, as follows.
- Annotation highlight.
- Annotation symbol: One annotation
- Annotation symbol: More than one annotation
-
Right click a selected value; select Add Annotation(s) on the Popup menu.
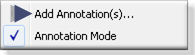
Note: Click the checked Annotation mode at any time to return to standard runtime mode.
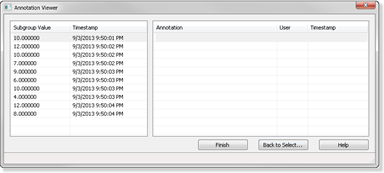
Result: The Annotation Viewer opens listing the selected values.
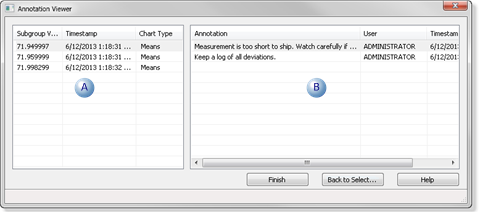
A Values selected for annotation are listed in the left-pane. Source Information includes the following. Subgroup value Sample value Timestamp Time the sample value was calculated Chart Type (e.g. Means) B Annotation information includes the following. Annotation All or part of the annotation. Note: An Annotation dialog box can be opened to display a longer annotation. User User who entered the annotation. Timestamp Time the annotation was entered. Note: Additional annotations for the same value are listed on separate lines.
Group of Values
Many values can be selected at one time for annotation.
-
Hold down the left-mouse button as you drag the mouse over the chart area with the values that should be selected.
A box displays around the selections.
-
Release the mouse button.
Each value in the group is surrounded by a box.
Results
The Annotation Viewer opens listing the selected values.