 CIMPLICITY
7. SPC Control: Bar Chart
Display options are available for Histograms and Pareto charts on the Bar Chart tab in the SPC Control Properties dialog box.
The chart that is selected on the Chart tab will be enabled.
- Histograms
- Pareto Charts
Histogram Charts
The Histogram chart is available for Variable properties. It is particularly valuable when setting up/adjusting your system and determining appropriate specification limits for the process.
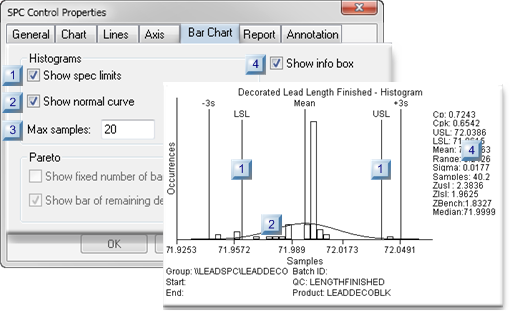
| 1 | Show spec limits. |
| 2 | Show normal curve |
| 3 | Max samples |
| 4 | Show info box |
| 1 | Show spec limits |
Displays/hides the specification limits (USL/LSL).
| Check | Displays the specification limits. |
| Clear | Hides the specification limits. |
| 2 | Show normal curve |
Displays/hides a normal distribution curve.
| Check | Displays a normal distribution curve |
| Clear | Hides the normal distribution curve. |
| 3 | Max samples |
Maximum number of samples that will be used to create the curve.
Note:
- The samples that are selected are based on the:
| o | Duration selection on the General tab in the SPC Control Properties |
| o | Sampling parameters selected in the General tab in the Variable Quality Characteristics Properties dialog box. |
- The actual number of samples may be slightly larger than the entered number. For example, if 40 is entered, the actual number of samples may be 40.2.
| 4 | Show info box |
Displays/hides a list of values calculated for the Histogram.
| Check | Displays the info list. |
| Clear | Hides the info list. |
|
Note:
The information/values that display are:
|
|
Pareto Charts
The Pareto chart provides a visual gage of the number of selected Defects that occur in the process. Visual aids can be selected, as follows.
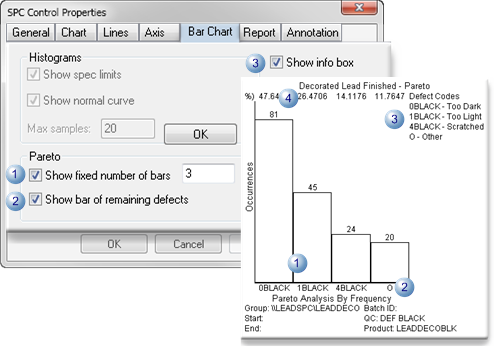
| 1 | Show fixed number of bars | Check or clear to do the following. | |
| Check | Displays the number of bars entered in the field. | ||
| Clear | Displays the number of bars for all defects that have values greater than 0. | ||
| 2 | Show bar of remaining defects |
Displays a bar that:
|
|
| 3 | Show info box | Displays/hides a list of defect names/descriptions that are included in the Pareto chart. | |
| Check | Displays the info list. | ||
| Clear | Hides the info list. | ||


