 CIMPLICITY
5. SPC Control: Line Display
The SPC Control Properties dialog box>Lines tab enables you to select whether to display/hide each of the control lines and zones.
Check each line type or zone that should display on the chart.
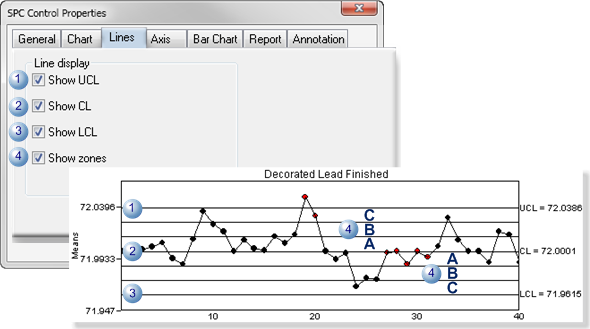
| 1 | UCL | Upper Control Limit |
| 2 | CL | Center Line |
| 3 | LCL | Lower Control Limit |
| 4 | Zones | A, B, C |
Notes
Zones are as follows.
| Zone | Area |
|---|---|
| C | Up to one standard deviation from the center line. |
| B | Between one and two standard deviations from the center line. |
| A | Between two and three standard deviations from the center line. |
In general, a control chart consists of the center line corresponding to the average value at which the quality characteristic should perform, and lines corresponding to the upper and lower control limits for the characteristic. The upper and lower control limits are also referred to as the upper and lower three-sigma control limits.


