
Customize a Trend Chart at Runtime
This topic describes how to access a trend chart in the runtime environment and customize it's settings.
Before you begin
About this task
Procedure
- Access the trend chart you want to customize.
-
On the chart's toolbar, select
 .
The Trend Configuration window appears.
.
The Trend Configuration window appears.
-
Modify the trend chart settings as specified in the following table.
Field Name Description Mode Select the mode of the trend chart. The following options are available: - Live: Plots real-time data from a Historian server and/or OPC UA server.
- Historical: Plots historical data from a Historian server.
Note: Changes made to Live affect Historical as well. For example, if you add/delete properties from the chart in the Live mode, these changes reflect when you move to the Historical mode as well.Duration Select a duration for which you want to plot the data. The selected duration is subtracted from the End time to deliver past trends. You can go back in time in minutes, hours, days, or provide a customized duration. - 1, 5, or 30 minutes
- 1, 2, 4, 8, or 24 hours
- 1 week
- 30 days
- Choose Custom and enter a different duration in the time format text box.
End Allows to set an end date and time for trending historical data. Select
 to update a specific date and
time.
to update a specific date and
time.- If you have set a date and time in the past, select Done to apply.
- If you want to set the current date and time, select Now to apply. The current time can also be set by enabling the toggle switch.
Now Allows to update the End time to your current system time. The toggle is enabled by default when you enter the Historical mode for the first time. Choosing a different date and time automatically disables the toggle. - Select
 to refresh ‘Now’ configured
charts. Use this option to instantly update the end time to
current time if the chart is already configured for
‘Now’.
to refresh ‘Now’ configured
charts. Use this option to instantly update the end time to
current time if the chart is already configured for
‘Now’. - You can also save a 'Now' configured chart as your favorite.
When you reload such charts from favorites, the end time is
set to the current system time, and trends are
displayed.Note: After upgrading to 2.1, values from previously saved favorites are updated to represent the range for end time instead of the start time. The ‘Now’ toggle remains disabled for old favorites.
Sampling Increment Select whether you want to increment the sampling data based on time or count, and then specify the time or count, respectively.  Note: The sampling increment may not always be honored. The maximum number of data points plotted on the trend chart is 3000 when sampling by time, and 8000 when sampling by count. You can zoom in to view more accurate data.
Display You have the option to set a display style on how tags appear across the trend card. The selected display style applies to configured source tags (except third party OPC UA and asset model tags), chart tooltip/legend, and Historian statistical data. Choose from these options: - Tag Name: Displays only tag name.
- Tag Description: Displays only tag description. Lengthy descriptions are truncated with an ellipsis. Move your cursor over ... to reveal the complete description. In the absence of a description, tag name is displayed by default.
- Tag Name and Description: Displays both tag name and description.
Notes You can add notes only to historical trends, and not for OPC UA based trends. Switch the toggle to enable viewing or adding a note on the trend chart.
On the trend chart:- To add a note for the first time for a specific data
point, select the data point, and then select
 .
. - To access a note, select
 . Note: You cannot modify or delete a note; if you want to augment a note, you can add additional notes.
 - To add an additional note for a data point, select
 .
. - To navigate through multiple notes, use
 and
and
 .
.
When you access an existing note, the timestamp and tag values that appear during the initial loading of the note correspond to the x-axis and y-axis values for the data point, respectively. If you select each individual note, the actual raw and timestamp values to which the comment was added in the Historian archive appear.
If you add a note to an interpolated value, it is added to the nearest raw value. Due to this, the value displayed in the note may not always match the value plotted on the chart.
Query Criteria Applies to Historical mode, and for Historian data sources only. This option allows you to query tag data based on timestamps. Note: Trend via Tag Query can be performed on the tags of the same Historian server only, and not from multiple Historian sources.If you want to change to a different Historian data source to query tags, do the following:- Clear the check box for all the tags from the current data source and select Apply.
- Reopen Tag Query Criteria.
- Select the (different) data source tags to add query condition/s.
For example, consider you have two tags in your system - Tag1, Tag2. You can configure a query criteria wherein you request to plot the Tag1 data for last one hour that matches with the conditions applied to the Tag2 data.- Select a duration to plot the data. For example, select 1H.
- Select Add Tag Query Criteria to
access the Tag Query Criteria
screen.

- Select a tag from the Proficy Historian data source. The selected tag appears under ADD CONDITIONS.
- Expand the tag and set up a condition. You can set up
multiple conditions using
AND,ORoperators.For example, you can query Tag1 (multiple tags can be trended) data for the timestamps wherein
Tag2 is greater than 100ANDTag3 is less than 500ORTag4 is equal to 300in the specified time range. - Select Apply.
The query fetches only the timestamp values where the condition/s are met. Any data that does not match the query criteria is filtered out from the trend chart display. As a result, you may find interrupted trend lines in the chart.
To modify or update any added query conditions, select the pencil icon.
Sources Data can be plotted to the trend chart using properties from an asset model. In the absence of an asset model, you can also directly browse the data source address space and select tags for the trend chart. Select Add Tags for Trend to select the properties or tags that you want to add to the trend chart.
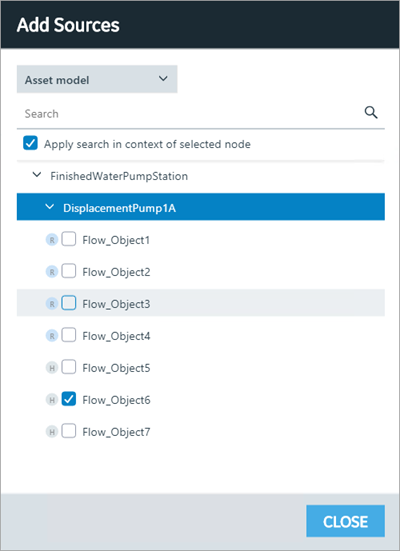
Tags marked as
 are from the Historian data source.
Tags marked as
are from the Historian data source.
Tags marked as  are from
the real time data sources such as iFIX, CIMPLICITY, and any
other OPC UA server.Note: Nodes only work for plotting historical data. They do not work in Live mode.
are from
the real time data sources such as iFIX, CIMPLICITY, and any
other OPC UA server.Note: Nodes only work for plotting historical data. They do not work in Live mode.SAMPLING MODE For each tag SOURCE, you can add multiple sampling modes. This option is available only for the historical mode. Select [Add Sampling Mode] to add additional sampling modes for a tag. For example, you can have 3 different sampling modes for a single tag in the trend chart. Highlight each mode with a different line color, style, and thickness.

These are the modes available to plot data:
- Trend To Raw
- Minimum
- Maximum
- Average
- Total
- Standard Deviation
- Interpolated
- Lab
- Lab To Raw
- Delta
- Delta Positive
- Delta Negative
You can trend each tag-sampling mode combination only once. For example, if Trend To Raw mode is applied to Water Temp tag, this mode becomes inactive for this tag. The other modes are available to use.
To delete a plotted sampling mode, select
 next to the tag.
For more information on the sampling modes, refer to the Historian documentation.
Specification Limits To monitor a process performance, you can define upper, lower, or targeted limits (from varied data sources) and plot these lines on the trend chart. Provide specification limits for UPPER LIMIT, TARGET, LOWER LIMIT as follows:- Enter values manually, (OR)
- Select Browse to browse the data source and select a tag to populate realtime data (current value).
To highlight each plotted line with a unique line color, thickness, and/or style, choose a COLOR, LINE WEIGHT, and LINE STYLE.

To remove a plotted limit from the chart, select
 next to
the specification limit. You can set the specification limits
for both live and historical mode, and save the chart to
favorites.
next to
the specification limit. You can set the specification limits
for both live and historical mode, and save the chart to
favorites.Chart Y Axis Configuration Allows to compare two or more tags/sources by having a common Y-axis on the trend chart. This option is disabled if you selected the Stacked Y-axis mode. - Individual Y Axis for each source: Select this option to include an individual Y-axis for each source on a trend chart. For example, if you have multiple tags trending on your chart, each tag has its own Y-axis.
- Single Y Axis for all sources: Select this option to include a common Y-axis for all the sources on a trend chart. For example, if you have multiple tags trending on your chart, all the tags share only a single Y-axis.
SHOW Y-AXIS Select the toggle to switch between showing or hiding the y-axis on a trend chart. This option is available under each tag/source if you selected individual y-axis for each source. AUTOFETCH LIMITS By default, the toggle is always turned on, to automatically fetch minimum (Low) and maximum (High) limits. Turn off the toggle if you want to provide manual limits for the chart. Enter values for AXIS LOW and AXIS HIGH to trend the data accordingly. In case you do not enter High and Low limits when the toggle is off, the values are auto scaled. For Individual Y-axis, the option to set limits is available under each tag/source.
For Single Y-axis, you can browse and select the tag/source, and set custom limits. Turn on the toggle to be able to browse tag/source.