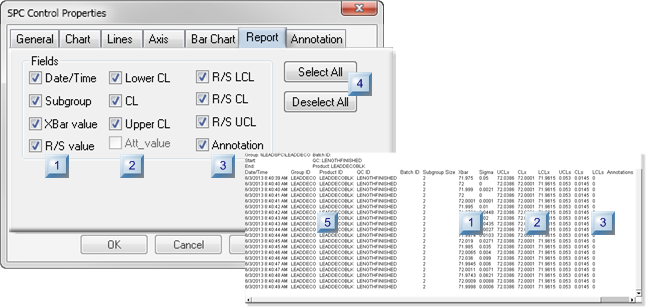
Checked fields on the SPC Control Properties dialog box>Report tab display as columns in the selected report.
Fields in each of the three columns on the SPC Control Properties>Report tab are enabled/disabled based on whether the quality characteristic is a variable or attribute.
|
1
|
Fields: Column 1.
|
|
2
|
Fields: Column 2.
|
|
3
|
Fields: Column 3.
|
|
4
|
Buttons.
|
|
5
|
Report: Quality Characteristic Description Columns
|
The first column includes the following fields.
| Field |
Description |
Variable |
Attribute |
|
|
|
Enabled for:
|
|
Date/Time
|
Value date/time: MM/DD/YYYY HH:MM:SS AM/PM
|
Yes
|
Yes
|
|
Subgroup
|
Size entered on the SPC Document General tab
|
Yes
|
Yes
|
|
XBar value
|
XBar/R or XBar/S variable value
|
Yes
|
No
|
|
R/S value
|
Range (XBar/R) or Sigma (XBar/S) variable value
|
Yes
|
No
|
The second column includes the following fields.
| Field |
Description |
Variable |
Attribute |
|
|
|
Enabled for:
|
|
Lower CL
|
Lower Control Limit value
|
Yes
|
Yes
|
|
CL
|
Center line value
|
Yes
|
Yes
|
|
Upper CL
|
Upper Control Limit value
|
Yes
|
Yes
|
|
Att_value
|
Attribute value
|
No
|
Yes
|
The third column includes the following fields.
| Field |
Description |
Variable |
Attribute |
|
|
|
Enabled for:
|
|
R/S LCL
|
Range or Sigma Lower Control Limit
|
Yes
|
No
|
|
R/S CL
|
Range or Sigma Center line
|
Yes
|
No
|
|
R/S UCL
|
Range or Sigma Upper Control Limit
|
Yes
|
No
|
|
Annotation
|
Annotations entered for selected values
|
Yes
|
Yes
|
Buttons are available to do the following.
|
Select All
|
Checks all of the check boxes available for the selected chart type.
|
|
Deselect All
|
Clears all of the check boxes.
|
|
5
|
Report: Quality Characteristic Description Columns
|
The following columns are not optional. They display even if all the check boxes have been deselected.
| Field |
Description |
|
Group ID
|
Group the QC is included in
|
|
Product ID
|
Product being tested
|
|
QC ID
|
Quality Characteristic ID
|
|
Batch ID
|
If a batch is used the batch ID; the column displays with no values if a batch is not being used.
|
 CIMPLICITY