Condition, Logic, and Calculation Nodes
Condition, Logic, and Calculation Nodes in Policies
Condition Nodes
Logic Nodes
Calculation Nodes
The following Calculation nodes perform calculations on single values: The following Calculation nodes perform calculations on a collection of data:Add, Subtract, Multiply, Divide, Exponent, and Remainder Nodes in Policy Designer
The following Calculation nodes represent basic mathematical calculations:
| Node | Description |
|---|---|
| Add | Adds one value to another value. |
| Subtract | Subtracts one value from another value. |
| Multiply | Multiplies one value by another value. |
| Divide | Divides one value by another value. |
| Exponent | Determines the number of times a value is multiplied by itself. |
| Remainder | Determines the remainder after a division operation. |
Each math node has two inputs. Input requirements differ depending on the type of math node.
- Input for Add, Subtract, Multiply, Divide, and Remainder nodes may be numeric values or certain time-based values.
- Inputs for Exponent nodes must be numeric values.
A math node has only one output. The output of a math node is the result of the mathematical calculation.
Node Properties
The Properties window for each math node contains the items that are described in the following table.
| Item | Description | Notes |
|---|---|---|
| First value | The first input value that will be used in the calculation. | None. |
| Calculation symbol | The symbol that corresponds with the mathematical calculation that is performed by the node. | None. |
| Second value | The second input value that will be used in the calculation. | None. |
| Display list | Determines the label that appears on the node in the policy model. | This list does not appear if you enter a constant in the corresponding section. |
Add Node
The following example illustrates how you can use an Add node to add a constant value to a value that is defined by a predecessor node. Consider the following nodes and connection.

In this example, the Add node adds 1 to the value in the Alert Level field of a Health Indicator record. The following image shows the Properties window for the Add node.

Remainder and Subtract Nodes
Suppose that you want to add reading values to a Health Indicator, but you know that the accuracy of the reading values is +/-10%. Before adding the reading values to a Health Indicator, use a policy to round down the reading values.
Consider the following nodes and connections. In the policy shown in the following image, the Remainder node is used in conjunction with a Subtract node to round down to the nearest ten the last reading value associated with a Measurement Location.

The following image shows the Properties window of a Remainder node. You can use the Remainder node to calculate the amount remaining after the Last Reading value is divided by 10. For example, if the last reading value is 87, the result of the remainder node is 7 (87/10=8 with a remainder of 7).

The following image shows the Properties window of a Subtract node. You can then subtract the remainder from the reading value. The result of this calculation is the reading value rounded down to the nearest ten. Continuing with the previous example, the result of this node is 80 (87-7=80).

Finally, the result of the Subtract node (80) is added to a Health Indicator Value record that is linked to a Health Indicator.
How Input Values Correspond to Calculations
The following table illustrates how the input values that you define for each node correspond to the mathematical calculations performed by the node. This table includes the mathematical calculation and output for each type of node when the first input value is 3 and the second input value is 2, as shown in the following image:

| Node Type | Mathematical Calculation | Output Value |
|---|---|---|
| Add | 3+2 | 5 |
| Subtract | 3-2 | 1 |
| Multiply | 3x2 | 6 |
| Divide | 3/2 | 1.5 |
| Exponent | 3^2 | 9 |
| Remainder | 3%2 | 1 |
Using Time-Based Values
The following tables summarize the possible combinations of time-based input values that you can use with Add, Subtract, Multiply, Divide, and Remainder nodes.
| First Value | Second Value | Output | Example |
|---|---|---|---|
| Time stamp | Time span | Time stamp | 1/11/2000 + 10 Days = 1/21/2000 |
| Time stamp | Number | Time stamp | 1/11/2000 + 10 = 1/21/2000 00:00:10 |
| Time span | Time stamp | Time stamp | 10 Days + 1/11/2000 = 1/21/2000 |
| Time span | Time span | Time span | 12 Days + 10 Days = 22 Days |
| Time span | Number | Time span | 12 Days + 10 = 12.00:00:10 |
| Number | Time stamp | Time stamp | 10 + 1/11/2000 = 1/21/2000 00:00:10 |
| Number | Time span | Time span | 10 + 12 Days = 12.00:00:10 |
| Time stamp | Time stamp | Invalid | N/A |
| First Value | Second Value | Output | Example |
|---|---|---|---|
| Time stamp | Time span | Time stamp | 1/11/2000 - 10 Days = 1/1/2000 |
| Time stamp | Number | Time stamp | 1/11/2000 - 10 = 1/10/2000 23:59:50 |
| Time span | Time stamp | Invalid | N/A |
| Time span | Time span | Time span | 12 Days - 10 Days = 2 Days |
| Time span | Number | Time span | 12 Days - 10 = 11.23:59:50 |
| Number | Time span | Time span | 10 - 12 Days = 11.23:59:50 |
| Time stamp | Time stamp | Time span | 1/11/2000 - 1/1/2000 = 10 Days |
| First Value | Second Value | Output | Example |
|---|---|---|---|
| Time span | Time span | Invalid | N/A |
| Time span | Number | Time span | 10 Days x 5 = 50 Days |
| Number | Time span | Time span | 5 x 10 Days = 50 Days |
| First Value | Second Value | Output | Example |
|---|---|---|---|
| Time span | Time span | Number | 1 day / 8 hours = 3 |
| Time span | Number | Time span | 1 day / 2 = 12 hours |
| Number | Time span | Invalid | N/A |
| First Value | Second Value | Output | Example |
|---|---|---|---|
| Time span | Time span | Time span | 15 Days % 10 Days = 5 Days |
| Time span | Number | Invalid | N/A |
| Number | Time span | Invalid | N/A |
And and Or Nodes in Policy Designer
And and Or nodes are Logic nodes that you can use in a policy model to specify whether or not policy execution should continue based on the results of the incoming logic paths.
Specifically:
- The And node evaluates whether or not all incoming logic paths result in a value of true passed to the And node.
-
The Or node evaluates whether or not at least one incoming logic path results in a value of true passed to the Or node.
Note: Unlike other nodes which require all immediate predecessor nodes to be executed in order for the node to be, the Or node requires only one immediate predecessor node to be executed in order for the Or node to be executed.
In a policy model, Logic nodes must be preceded immediately by comparison or other Logic nodes. A value of true is passed to the Logic node when the logical result of the preceding node matches the logic path configured for the corresponding connection. For example, if the logical result of an immediately preceding condition node is no and the logic path configured for the corresponding connection is no, a value of true is passed to the Logic node.
The output of a Logic node is the logical result of the node. Specifically, when a Logic node is executed:
- If the Logic node's criteria is met, the output (that is, logical result) of the node will be yes.
- If the Logic node's criteria is not met, the output (that is, logical result) of the node will be no.
The logical results of Logic nodes are used by connections to successor nodes in order to determine if the successor node will be executed. You can use the Properties window for a connection starting at a Logic node to configure a logic path for the connection. If you do not configure a logic path for a connection, a Yes path is assumed but does not appear on the model. The Predix Essentials system will execute only the branches of a policy model where the logical result of the Logic node matches the logic path defined for the corresponding connection.
More Information: Logical Results
The following table summarizes what the result of each Logic node will be for various input combinations.
| Input A | Input B | And Node Result | Or Node Result |
|---|---|---|---|
| True | True | Yes | Yes |
| False | False | No | No |
| True | False | No | Yes |
And Node
The following example illustrates how you can use the And node to monitor policy execution. To simplify this example, only constant values are used in the policy model. Consider the following nodes and connections, which are shown after validation has been run.

In this example, you can see that each node executed successfully. The logical result of the And node is yes because all incoming logic paths result in a value of true passed to the And node (that is, the logical result of each preceding condition node matches the logic path of the corresponding connection). Therefore, policy execution continues past the And node.
Or Node
The following example illustrates how you can use the Or node to monitor policy execution. To simplify this example, only constant values are used in the policy model. Consider the following nodes and connections, which are shown after validation has been run.
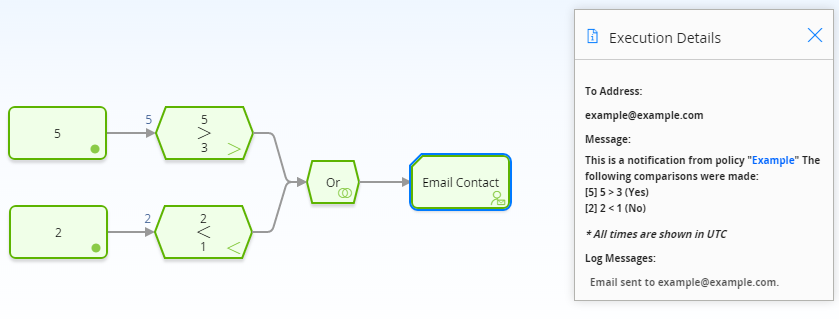
In this example, you can see that each node executed successfully. The logical result of the Or node is yes because the logical result of at least one incoming logic path results in a value of true passed to the Or node (that is, the result of the 5 > 3 Condition node is yes, which matches the logic path of the corresponding connection). Therefore, policy execution continues past the Or node.
Average Nodes in Policy Designer
An Average node is a Calculation node that you can use in a policy model to calculate the average value of data in a specified column of a collection.
The input for an Average node must be a collection with a column containing numeric or time-based values. The output of an Average node, Value, contains the average value of data in the specified column.
Node Properties
The Properties window for an Average node contains the items that are described in the following table.
| Item | Description | Notes |
|---|---|---|
| Collection section | Specifies the collection that contains the values that you want to average. |
You can select |
| Collection Column section | Specifies the column that contains that values that you want to average. |
This list contains the columns that are available in the selected collection.
The column that you select must contain numeric or time-based values. |
 to specify the output of a predecessor node in this section.
Average node
The following example illustrates how you can use an Average node to evaluate the readings that are associated with a Health Indicator record and return the average reading value. Consider the following nodes and connection.

As shown in the following image, you can use the Properties window for the Average node to select the Health Indicator node and the Readings option. The Value column of the Readings collection is also selected, indicating that the output of the node is the average of the values in the Value column.

Case Nodes in Policy Designer
A Case node is a Condition node that you can use in the policy model to set up scenarios in which the output values of the node should be changed automatically based on specific input values. Throughout this documentation, we refer to each defined scenario as a Case. Each Case within the Case node has an input value and one or more output values that the Predix Essentials system will use if the value in a defined input field matches the input value of the Case.
There are two types of Cases in the Case node, which we refer to as the If Case and Else Case throughout this documentation:
- If Case
- The type of Case that is executed if the value in a defined input field matches a specific input value that you specify. You can define one or more If Cases for a given Case node.
- Else Case
- The Case that is executed by default if the value in a defined input field does not match a specific input value that you specified in an If Case. There is only one Else Case for a given Case node.
- Change the output value of a node from one value to another.
- Combine policy logic after a Condition node in the policy model.
The input of a Case node must be a single value or the logical result of a comparison node. The output of a Case node is the value that you define in the Value column corresponding to the output option that you select in a successor node. Outputs may be single values or collections.
Node Properties
The Properties window for a Case node contains the items that are described in the following table.
| Item | Description | Notes |
|---|---|---|
| Input section | Specifies the field whose value you want to compare to each If Input = value in order to determine the output(s) of the Case node. | If you select a comparison Condition node as a predecessor node, the logical result of the condition will be used automatically as the input value. |
|
If Case section | ||
| If Input = text box | Specifies the value that must match the value that is defined in the Input section in order for the corresponding If Case to be executed. | You can use the  and and  buttons in the If Input = row to add or delete If Cases in the Case node. buttons in the If Input = row to add or delete If Cases in the Case node. |
| Output section | Specifies the output(s) for the corresponding If Case. The output section contains two columns:
| You can use the and buttons in the output section to add or delete output rows. When you add or delete an output row in one Case, corresponding output rows in all cases are added or deleted automatically. |
| Else Case section | ||
| Else output section | Specifies the output(s) of the Else Case. The Else Case will be executed if the value in the If Input = section does not match any value defined in an If Input = text box. | This output section contains the same functionality as described above. You cannot delete the Else Case from the Case node. |
Change the Output Value of a Node from One Value to Another
You can use the Case node in the policy model to change a node's output values so that they can be used in successor nodes to perform calculations or actions. For example, you can use the Case node to convert character-based values from a Health Indicator reading or an AMS Asset status message to numeric values that you can use in subsequent calculations.
Consider the following policy model in which reading values from a character-based Health Indicator record are converted to numeric values. The values are then added to a Health Indicator record that uses numeric values.

As shown in the following image, you can use the Properties window of the Case node to indicate that the output value of the Case node will differ depending on the reading values associated with the Character Health Indicator node.

In this example, one output, HI Value, is defined. For this output, if the value in the Last Char Reading Value field is:
- 1-OK, the output value of the Case node will be 100. This is an If Case.
- 2-Not OK, the output value will be 50. This an another If Case.
- Any other value, the output value will be 0. This is the Else Case.
These values represent the numeric equivalents of the character-based readings associated with the Character Health Indicator node.
As shown in the following image of the Properties window of the Add Value to Health Indicator node, you can add the converted values to a numeric-based health indicator by selecting the HI Value output from the Case node.

Combine Policy Logic after a Condition Node in the Policy Model
You can use the Case node to combine policy logic in situations when a Condition node's successor nodes are the same in each logic branch. Rather than creating separate logic paths with duplicate nodes, you can use a Case node to define different outputs for each logical result of the condition. This is especially useful in large policy models with multiple logic branches and duplicate nodes.
The following image shows what a policy that uses Condition nodes looks like without Case nodes in the model.

Notice that the Add Value to Health Indicator node appears three times, and the Email Contact node appears twice.
The following image shows what the same policy looks like when you use Case nodes in the model.

In this model, each Case node takes the place of a logic branch. Rather than splitting the model into separate logic paths, the Case node supplies a specified output corresponding to the logical result of the preceding Conditionnode. Notice that in this model the Add Value to Health Indicator node and the Email Contact node appear only once.
The following image shows what the Properties window looks like for the first Case node in the preceding image.

In this example, if the logical result of the Condition node named Greater Than is:
- Yes, the output of the node will be 50.
- No, the output will be 0.
When Output 1 is selected as the input of a successor node, the Predix Essentials system will supply the corresponding value to the successor node.
Collection Filter Nodes in Policy Designer
A Collection Filter node is a Calculation node that you can use to apply one or more filters to collections that are represented by nodes in the policy model. Filters may, for example, specify a range of values or dates within which readings must fall in order to be evaluated by successor nodes.
The input of a Collection Filter node must be a collection of data. The output of a Collection Filter node, Filtered Collection, includes only the rows in a collection that pass all filter criteria that are defined in the Collection Filter node's Properties window.
Node Properties
The Properties window for a Collection Filter node contains the items that are described in the following table.
| Item | Description | Notes |
|---|---|---|
| Collection section | Specifies the collection that you want to filter. |
You can select |
|
| Adds a new filter row to the Collection Filter node. | Each filter row consists of a column, operator, condition, and the button. |
| Column list | Specifies the column whose values you want to use in the filter. | This list contains the columns that are available in the selected collection. |
| Operator list | Specifies the comparison operator that you want to apply to the values in the selected column. | This list contains the following operators:
|
| Condition value | The value that will be compared against the values in the corresponding column to determine the output of the node. |
You can select |
 button button | Deletes the corresponding filter row from the Collection Filter node. |
None |
Collection Filter node
The following example illustrates how you can use the Collection Filter node to filter query results such that only certain results are used in subsequent calculations. Consider the following nodes and connection.

In this example, a Query node, Policy Events Query, is connected to a Collection Filter node.
As shown in the following image, you can use the Properties window of the Collection Filter node to define multiple filters that are applied to the full table of results from the query. Specifically, the query results are filtered to include only the policy events that lasted longer than ten seconds, occurred within the last month, and have the name IOW Excursion.

The output of the Collection Filter node (the filtered results of the query), can then be used by successor nodes to perform a variety of calculations.
Comparison Nodes in Policy Designer
Comparison nodes are Condition nodes that you can use to compare two input values using the comparison operator that corresponds to the name of the node. The following comparison nodes are available:
- Equal
- Not Equal
- Greater Than
- Greater Than or Equal
- Less Than
- Less Than or Equal
Each comparison node requires two inputs, which must be single values. For Equal and Not Equal nodes, inputs can be any type of data. For the remaining comparison nodes, inputs must be numeric or time-based values.
The output of a comparison node is the logical result of the comparison (that is, yes or no). The output of a comparison node can be used only as an input to Case or Logic nodes. For all other successor nodes, the output is used by the connection to the successor node in order to determine if the successor node will be executed.
You can use the Properties window for a connection starting at a comparison node to configure a logic path for the connection. If you do not configure a logic path for a connection, a Yes path is assumed but does not appear on the model. The Predix Essentials system will execute only the branches of a policy model where the logical result of the comparison matches the logic path defined for the corresponding connection.
Node Properties
The Properties window for each comparison node contains the items that are described in the following table.
| Item | Description | Notes |
|---|---|---|
| First value |
The input value that will be compared to the second input value. |
You can select |
| Operator symbol | The symbol that corresponds with the comparison operation that is performed by the node. | None. |
| Second value | The input value that will be compared to the first input value. |
You can select |
| Display list | Determines the label that appears on the node in the policy model. | This list does not appear if you enter a constant in the corresponding section. |
Comparison nodes
The following example illustrates how you can use a comparison node to compare the value in a field of a predecessor node to a constant value. Consider the following nodes and connections.

The following image shows what the Properties window looks like for the Greater Than or Equal To node.

Based on the connection properties, the following logic will be applied when the policy is executed:
- If the DA Reading Value is greater than or equal to 900, an email message will be sent. This logic is determined by the connection between the Greater Than or Equal To Condition node and the Email Analyst node. Because a logic path is not defined, a value of Yes is assumed but does not appear on the model.
- If the DA Reading Value is not greater than or equal to 900, a Policy Recommendation record will be created. This logic is determined by the No logic path specified for the connection to the Create Recommendation node.
Convert Type Nodes in Policy Designer
- Boolean
- Time & Date
- Decimal
- Integer
- String
- Time Span
Node Properties
The Properties window for a Convert Type node contains the items described in the following table.
| Field | Description | Note |
|---|---|---|
| Output Type | Specifies the data type to which you want to convert the value. | None. |
| Input Value | Specifies the value that you want to convert. | If the data type of the input value is such that it cannot be converted to the data type specified in the Output Type field, the node will not be executed during the execution of the policy. |
How Values Are Converted
The following table describes how the input values of different data types are converted by the Convert Type node.
| Data Type of Input Value | Data Type Specified for Output Value | |||||
|---|---|---|---|---|---|---|
| Boolean | Decimal | Integer | String | Time & Date | Time Span | |
| Boolean | Retained without conversion. |
|
| Converted to the string representation of the value | Cannot be converted, and results in execution failure of the node | Cannot be converted, and results in execution failure of the node |
| Dataframe | Cannot be converted, and results in execution failure of the node | Cannot be converted, and results in execution failure of the node | Cannot be converted, and results in execution failure of the node | Converted to the string representation of the value | Cannot be converted, and results in execution failure of the node | Cannot be converted, and results in execution failure of the node |
| Time & Date | Cannot be converted, and results in execution failure of the node | Converted to the number of seconds elapsed between January 1, 1970 and the value | Converted to the number of seconds elapsed between January 1, 1970 and the value | Converted to the string representation of the value | Retained without conversion | Cannot be converted, and results in execution failure of the node |
| Decimal |
| Retained without conversion | Rounded to the nearest whole number | Converted to the string representation of the value | Converted to date after considering the value as the number of seconds since January 1, 1970 | Converted to represent number of seconds |
| GUID | Cannot be converted, and results in execution failure of the node | Cannot be converted, and results in execution failure of the node | Cannot be converted, and results in execution failure of the node | Converted to the string representation of the value | Cannot be converted, and results in execution failure of the node | Cannot be converted, and results in execution failure of the node |
| Integer |
| Retained without conversion | Retained without conversion | Converted to the string representation of the value | Converted to the corresponding date after considering the value as the number of seconds elapsed since January 1, 1970 | Converted to represent number of seconds |
| String |
| Converted to the corresponding numeric value and then rounded to the nearest whole number | Converted to the corresponding numeric value | Retained without conversion |
|
|
| Time Span | Cannot be converted, and results in execution failure of the node | Converted to the number of seconds represented by the value | Converted to the number of seconds represented by the value | Converted to the string representation of the value | Cannot be converted, and results in execution failure of the node | Retained without conversion |
Convert Type node
The following example illustrates how the Convert Type node can be used to convert the text string output of a Text node to a time span value.

In this example, the Text node is configured to create a text string that indicates a time span, using the values represented by the Point Value nodes. Because the Subtract node cannot perform any calculation on a text string, the Convert Type node converts the string to a value of the Time Span data type. The converted time span value is then used in the Subtract node to calculate the required date.
The following image illustrates the Properties window of the Convert Type node described in this example.

Count Nodes in Policy Designer
A Count node is a Calculation node that you can use in a policy model to calculate the total number of rows in a collection.
The input for a Count node must be a collection. The output for a Count node, Value, contains the result of the calculation.
Node Properties
The Properties window for a Count node contains the items that are described in the following table.
| Item | Description | Notes |
|---|---|---|
|
Collection section | Specifies the collection for which you want to calculate the total number of rows. |
You can select |
Count node
The following example illustrates how you can use a Count node in the policy model to determine if any Measurement Location readings were recorded within the last week. Consider the following nodes and connections.

In this example, a Collection Filter node is used to filter the readings associated with the Measurement Location node to only the readings that occurred within the last week. The Count node is then used to calculate the number of readings that occurred. The following image shows what the Properties window for the Count node looks like.

Is Null Nodes in Policy Designer
An Is Null node is a Calculation node that you can use to specify a default value that should be used in subsequent calculations in the event that the input value is null. You can also use this node in combination with a logic node to specify an action to be taken in the event that an input value is null.
The input of an Is Null node must be a single value. The output of an Is Null node, Answer represents either of the following two values:
- If the input value is not null, Answer, represents the same input value.
- If the input value is null, Answer represents the value that you specify in the Properties window.
Node Properties
The Properties window for an Is Null node contains the items that are described in the following table.
| Item | Description | Notes |
|---|---|---|
| Input Value section | Specifies the value that you want to determine whether it is null. |
You can select |
| Value if Input is Null section |
Specifies the output value of the node if the value specified in the Input Value section is null. |
You can select |
Assign a default value if a value is null
The following example illustrates how you can use the Is Null node in a policy model to define a default value to be used in subsequent nodes in the scenario where the input value is null.
Consider the following nodes and connections.

As shown in the following image, you can use the Is Null node to check whether or not the Criticality field in the record associated with the AMS Asset node has a value. If there is no value, the Is Null node output will be 0.

Then, as shown in the following image of the Properties window for the Case node, you can now use the output of the Is Null node to map the numeric Criticality values to corresponding character values (HIGH, MEDIUM, and LOW), which are used to populate the Recommendation Priority field when the Create Recommendation node is executed.

Using the Is Null node in this way allows you to translate a null value to an actual value that can be used in subsequent calculations and actions.
Trigger an action if a field is null
The following example illustrates how you can use the Is Null node in a policy model to trigger some action if a particular field is null.
Consider the following nodes and connections.

As shown in the following image, you can use the Is Null node to check whether or not the Criticality field in the record associated with the AMS Asset node has a value. If there is no value, the Is Null node output will be -1. The value -1 was chosen in this case because it is a value that is invalid for criticality; therefore, it serves as an indication that the Criticality field does not contain a value.

The Equal condition node in the policy evaluates whether the value from the Is Null node is equal to -1. If it is, this indicates that the Criticality field contains no value and an email alert is sent.
Last Nodes in Policy Designer
A Last node is a Calculation node that you can use in a policy model to retrieve the last row in a collection, whose fields you can then use in successor nodes to perform various calculations or actions.
The input for a Last node must be a collection. The output for the Last node is any field in the row that the Last node retrieves.
Node Properties
The Properties window for a Last node contains the items that are described in the following table.
| Item | Description | Notes |
|---|---|---|
| Collection section | Specifies the collection from which you want to retrieve the last row. |
You can select |
Last node
The following example illustrates how you can use a Last node to retrieve the most recent reading associated with a Measurement Location record and use this value in a subsequent calculation. Consider the following nodes and connections.

As shown in the following image, you can use the Properties window for the Last node to select the Measurement Location node and the Readings option. When this option is selected, the Last node evaluates the readings that are associated with the Measurement Location record and returns the last row in the collection, which contains the most recent reading.

You can use the most recent reading in various subsequent calculations. In this example, the Greater Than node evaluates the value of the most recent reading to determine whether or not it is greater than 1,000.
Math Node
A Math node is a Calculation node that you can use in the policy model to perform mathematical operations on numeric input values. The node performs operations on the values represented by variables that you define for the node. It evaluates the expression that you provide (for example, a^2+b*c) based on the input values, mathematical functions, and operators used. The resulting value of the expression is returned as the output of the Math node, which can be used in another node in the policy model. The variables used in the mathematical expression defined for a Math node can be configured to represent a single numeric value or a collection of numeric values.
Node Properties
The Properties window for a Math node contains items that are described in the following table.
|
Item |
Description |
Note |
|---|---|---|
| Math expression | The mathematical expression to be evaluated. |
|
| Name | The variable name that you may have used in the Math expression. |
|
| Value | The value of the named variable. | This must be a numeric value or collection of numeric values. |
|
| Adds a row for Name and Value. | None |
| Deletes the corresponding row. | None. |
How Input Values Correspond to Calculations
The following table describes how the input values that you define for a Math node correspond to the mathematical operations performed by the node. Here, 'a' and 'b' are variables whose values are 5 and 8, respectively.
|
Math expression |
Output |
Note |
|---|---|---|
| 2+pi | 5.1415926536 | pi is a mathematical constant. |
| a!+b | 128 | This is a factorial operator. |
| a=b^2 | 0, if false; 1, if true. | ^ is an exponentiation operator. |
| if(a>b,100,0) | 0, if false; 100, if true. | > is a relational operator. |
| sqrt(a+b) | 3.6055512755 | sqrt is a square root operator. |
How Input Values Correspond to Calculations using Logical Operators
The following table describes how the input values that you define for a Math node correspond to the mathematical operations performed by the node when the mathematical expression contains logical operators. Here, A, B, and C are variables whose values are 1, 0, and 0 respectively.
|
Math expression |
Output |
Note |
|---|---|---|
| A | B & C | 1 (that is, True) | The And (&) operator takes precedence over the Or (|) operator |
| (A|B) & C | 0 (that is, False) | None |
| A | (B&C) | 1 (that is, True) | None |
How A Collection of Input Values Represented by a Single Variable Correspond to Calculations
The following table describes how a collection of input values that are represented by a single variable defined for a Math node corresponds to the mathematical operations performed by the node. Here, 'a' is a variable that represents a collection of values 10, 20, 30, and 40, and 'b' is a variable that represents a collection of values 100, 110, 120, and 130.
|
Math expression |
Output |
Note |
|---|---|---|
| add(a) | 100 | add is a summation operator. |
| mean(a,b) | 70 | mean is an average value operator. |
| a1+b1 | 110 | You can reference individual values in the collection by adding a number to the end of the variable name. |
Math node
The following example illustrates how you can use the Math node to evaluate a Math expression.
Consider the following policy model that is designed to provide an email alert when an equipment has exhausted the threshold percentage of its life expectancy.

The threshold percentage of life used for the equipment is stored as a Technical Characteristic. The life data of the equipment (for example, hours for turbine, starts for crane, take-offs for aircraft, tonnes moved for mining equipment), is stored as Measurement Location readings.
The percentage of expected life of the equipment is calculated in the Math node using the Cumulative Distribution Function (CDF) of the Weibull Distribution, which is a mathematical function for analyzing life data.
The Math expression used for this calculation is as follows:
100*(1-e^(-((Time/Eta)^Beta)))
where:
- e is a mathematical constant.
- Time is the life used.
- Eta and Beta are Weibull distribution parameters.
The following image shows the Properties window of the Math node:

To easily identify the Measurement Location, Technical Characteristic, and Weibull Distribution parameters associated with the equipment, the Equipment Entity input node is specified as the primary node, indicating that the record specified for this node is the primary record to which all the other input records (represented by other Input nodes) will be linked.
The Weibull Distribution Entity input node provides the distribution parameters (that is, Eta and Beta), which were determined in the Reliability Analytics module by analyzing the failure data of a similar equipment.
The Life Used Measurement Location input node provides the readings to the Recent Reading Last calculation node, which retrieves the latest measurement reading (that is, Time).
The resulting value of the Math expression is passed to the Cumulative Probability Return Value action node, which will include the value in the policy execution history.
The Life Used Alert Level Entity input node provides the Technical Characteristic value to a comparison condition node, which compares it with the output of the Weibull CDF Math calculation node.
When the Weibull CDF value exceeds the Technical Characteristic value (that is, the threshold percentage) of the equipment, the message specified in the Email Text calculation node is sent via email to the user specified in the Email Contact action node.
The following image shows the Execution Details window of the Math node.

Min and Max Nodes in Policy Designer
Min and Max nodes are Calculation nodes that you can use in a policy model to determine the row of a collection which contains the smallest or largest value, respectively, in a specified column.
The input for a Min or Max node must be a collection with a column containing numeric or time-based values. The output of a Min or Max node is any field in the row that the Min or Max node retrieves. If multiple rows contain the minimum or maximum value, then only the first row encountered is returned.
Node Properties
The Properties windows for Min and Max nodes contain the items that are described in the following table.
| Item | Description | Notes |
|---|---|---|
| Collection section | Specifies the collection for which you want to determine the smallest or largest value in a certain column. |
You can select |
| Collection Column section | Specifies the column that contains the values of which you want to determine the smallest or largest value. | This list contains the columns that are available in the selected collection.
The column that you select must contain numeric or time-based values. |
Max node
The following example illustrates how you can use a Max node to determine which row of a query has the largest value in certain field and then use a successor node to evaluate a different field in the same row. Consider the following nodes and connections.

As shown in the following image, you can use the Properties window for the Longest Duration Max node to select the Query node and the Result Set option. The Duration (seconds) column of the Result Set is also selected, indicating that the query row with the longest duration will be returned.

As shown in the following image, you can then use the Properties window for the Equal node to determine if the Severity field in the query row with the longest duration contains the value Warning.

Round Nodes in Policy Designer
A Round node is a Calculation node that you can use in a policy model to peform the following:
- Round a value to a specific number of decimal places. This is called decimal rounding.
- Round a value to a specific number of significant figures. This is called precision rounding.
The input of a Round node must be a single, numeric value. The output of a Round node, Answer, contains the rounded value.
About Decimal and Precision Rounding
When you use decimal rounding, you can specify the number of decimal places to which you want to round the input value. For example, if the input value is 3.51 and you indicate that you want to round to the nearest tenth (by specifying the value 1 in the Digits box on the Properties window), the input value will be rounded to 3.5.
When you use precision rounding, you can specify the number of digits that you want keep from the input value. For example, if the input value is 7,658,321 and you indicate that you want to keep the first three values (by specifying the value 3 in the Digits box on the Properties window), the input value will be rounded to 7,660,000 (where the third digit, 5, is rounded to 6, and the remaining digits are changed to 0).
Node Properties
The Properties window for a Round node contains the items that are described in the following table.
| Item | Description | Notes |
|---|---|---|
| Value section | Specifies the value that will be rounded. |
You can select |
| Digits section | The value in this section serves a different purpose depending on the option that you select in the Mode section. You can select:
|
You can select If the list in the Mode section contains the value:
Regardless of the values that you specify for the Round node, when you validate the policy logic, only two decimal places are displayed. You can see the actual values by accessing the Properties window for the appropriate node. |
| Mode list | Specifies the type of rounding that the node will perform. | This list contains the following options:
By default, the Mode list contains the value Decimal rounding and the Digits box is empty (this is the same as typing 0 [zero]). This means that decimal values will be rounded to the nearest whole number. |
Round node
The following example illustrates how you can use the Round node in a policy model to round the value of an OPC Tag reading, represented by the Pressure node, to the nearest ten. Consider the following nodes and connection.

As shown in the following image, you can use the Properties window for the Round node to specify the type of rounding which you want to use. In this example, Precision rounding is selected as the type of rounding and 1 is specified as the number of digits from the input value that will be kept. This means that if, for example, the input to the node is 68, the output value will be 70.

The Round node in this example could be connected to various successor nodes in order to facilitate calculations. You could, for example, connect the Round node to a Case node, and then define a specific case to be executed based on the rounded input (that is, 10, 20, 30, and so on). Using the Round node in this way facilitates the execution of the Case node by limiting the number of possible inputs.
Sum Nodes in Policy Designer
A Sum node is a Calculation node that you can use in a policy model to calculate the total value of data in a specified column of a collection.
The input for a Sum node must be a collection containing numeric or time span values. The output of a Sum node, Value, contains the result of the calculation for the specified column.
Node Properties
The Properties window for a Sum node contains the items that are described in the following table.
| Item | Description | Notes |
|---|---|---|
| Collection section | Specifies the collection that contains the values for which you want to calculate the total value. |
You can select Note: If the input specified for a Sum node is an empty collection, the resulting answer from the Sum node is automatically zero (0).
|
| Collection Column section | Specifies the column that contains that values for which you want to calculate the total value. | This list contains the columns that are available in the selected collection.
The column that you select must contain numeric or time span values. |
Sum node
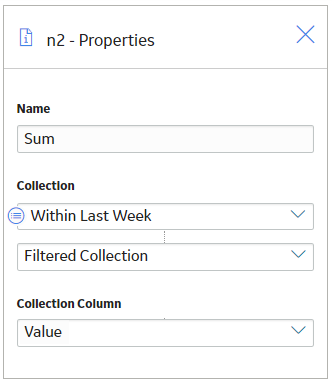
The following example illustrates how you can use a Sum node in a policy model to determine the total value of the Measurement Location readings that were taken within the last week. Consider the following nodes and connections.

In this example, the Collection Filter node is used to filter the readings associated with the Measurement Location node to only the readings that were recorded within the last week. The Sum node is then used to calculate the total value of these readings. The following image shows what the Properties window looks like for the Sum node.
Text Nodes in Policy Designer
A Text node is a Calculation node that you can use in a policy model to create a custom text string based on constants and the values returned by other nodes in a policy execution.
The inputs for a Text node must be single values. The output of a Text node, Answer, contains the custom text string.
Node Properties
The Properties window for a Text node contains the items that are described in the following table.
| Item | Description | Notes |
|---|---|---|
| Text Pattern box | Defines the pattern for the custom text string that will be the output of the Text node. | You must enter a valid .NET String.Format expression in this box. When you create the text pattern, the index numbers you use must be sequential starting at zero. However, the numbers do not have to be listed sequentially within the string and each number can be used multiple times. |
| Index / Value section | Specifies the value that each index specified in the Text Pattern box represents. | When the node is executed, the indexes in the text string will be replaced with the corresponding values you specify in this section. Important: You must define values for all indexes defined in the Text Pattern box. You can select You can use the Note: Constant values to represent dates (e.g., now, today, Sunday, October, etc.) or specific values (e.g., Pi or e) are not supported in this section. To use these one of these constants, you must define it using a Constant or Point Value node with an appropriate type. |
.NET String.Format Expressions
The Text node supports .NET String.Format expressions, including the formatting capabilities supported by String.Format. The following table shows various example expressions and the resulting strings.
| Text Pattern | Defined Index Values | Resulting String |
|---|---|---|
|
The temperature of the motor is {0} degrees Celsius. | {0}=12 | The temperature of the motor is 12 degrees Celsius. |
| The temperature of the {1} is {0:F2} degrees Celsius. |
{0}=23.456 {1}=pump | The temperature of the pump is 23.46 degrees Celsius. |
| The temperature was recorded at {0:t} on {0:d}. |
{0}= 1/1/2016 05:30:00 | The temperature was recorded at 5:30 AM on 1/1/2016. |
| The cost to repair the damaged part is {0:C2}. | {0}=1600 | The cost to repair the damaged part is $1,600.00. |
Text node
The following example illustrates how you can use the Text node in a policy to create a custom email message using various values from the policy's execution.

In this policy, the last reading related to a particular Measurement Location record is monitored. If the reading value exceeds the corresponding Upper Level 3 limit and no recommendations have been created since the reading was recorded, an email message is sent. The body of the email message includes a custom text message created using the Text node.
The following image shows the Properties window for the Text node.

You can see that various values from the policy execution are included within the text, thereby giving the recipient of the email further details and context surrounding the conditions that caused the message to be sent.
Assume that the policy returns the following values:
- Measurement Location - Upper Level 3 Numeric Value: 90.555
- Measurement Location - Checkpoint ID: chk-005
- Last Reading - Timestamp: 3/9/2016 12:27 PM
In this case, the output of the string node will contain the following text: Latest Reading for Measurement Location chk-005 taken on Wednesday, March 9, 2015 exceeds the Upper Level 3 limit of 90.55. No Recommendation has been created for this ML on or after Wednesday, March 9, 2015.
Threshold Statistics Nodes in Policy Designer
A Threshold Statistics node is a Calculation node that you can use in a policy model to determine the frequency and duration over which input values cross a defined threshold (that is, meet a defined condition).
The input for a Threshold Statistics node must be a collection with columns containing timestamps and numeric values. A Threshold Statistics node generates the following outputs:
- Count, which represents the number of times that input values crossed the defined threshold.
- Accumulated Time, which represents the amount of time over which input values crossed the defined threshold.
Node Properties
The Properties window for a Threshold Statistics node contains the items that are described in the following table.
| Item | Description | Notes |
|---|---|---|
| Collection section | Specifies the collection for which you want to calculate a threshold statistic. |
You can select |
| Timestamp Column list | Specifies the column that contains the timestamps that you want to use to calculate the accumulated time during which the input values cross the defined threshold. | This list contains the columns that are available in the selected collection. |
| Value Column list |
Specifies the column that contains the input values that will be compared to the threshold value. |
This list contains the columns that are available in the selected collection. |
| Threshold section | Specifies the threshold value that will be compared to the values that are defined in the Value Column list. |
You can select |
| Operator list | Specifies the comparison operator that will be used to compare inputs values to the threshold value. | This list contains the following operators:
|
Threshold Statistics node
The following example illustrates how you can use a Threshold Statistics node with Condition nodes to evaluate how many times and for how long reading values exceeded a defined threshold. Consider the following nodes and connections.

In this model, the collection of readings from the Health Indicator node, which represents a temperature, are filtered by the Filter This Week Collection Filter node to select the Readings for the current week. The filtered collection of Readings is passed to the Above 600 F Threshold Statistics node, which compares the filtered Readings to the defined threshold. The outputs from the Above 600 F Threshold Statistics node,(that is, the count of threshold exceedances and the accumulated time for which the threshold was exceeded) are compared to limit values using two Greather Than nodes. If either Greater than condition is met, an Email node is used to alert.
As shown in the following image, you can use the Properties window for the Above 600 F Threshold Statistics node to:
- Indicate that you want to evaluate the filtered collection of Readings.
- Identify the Timestamp and Value columns of the HDA Readings collection as the columns that store the timestamps and values that you want to evaluate.
- Set the Threshold against which you want to compare the values.
- Indicate the operator to use when comparing the Values to the Threshold.

More About This Example
To further explain this example, consider the following graph, where:
- The x-axis displays timestamps.
- The y-axis displays reading values.
- The blue line displays reading values that were added to the Health Indicator on specific dates.
- The red line identifies the threshold value 600.

In the graph, you can see that a reading value above 600 occurred two times, where one value was 620 (on 2021-06-03) and the other value was 630 (on 2021-06-05). These values are treated as two separate occurrences of exceeding the threshold value because the reading value dropped below 600 in between. In this scenario, the condition Count > 1 would be true, but the condition Accumulated Time > 3 Days would be false.
Now consider the following graph in which the value recorded on 2021-06-04 was also above 600. In this scenario, the Predix Essentials system determines that the threshold value was exceeded only one time, not three times. Specifically, whenever a reading value exceeds the threshold value, if the threshold value continues to be exceeded with each subsequent reading value, the Predix Essentials system treats it as one occurrence of exceeding the threshold. Whenever a subsequent reading value drops below the threshold value, the next time another reading value exceeds it again, the Predix Essentials system treats that as a separate occurrence.

Here, you can see that the first reading value that exceeded the threshold value is 620. After that, two consecutive reading values also exceeded the threshold: 625 and 630. These additional reading values, however, are not treated as a second occurrence of exceeding the threshold value because they are consecutive.
The duration of each exceedance is calculated as the difference between the timestamp of the first Reading which exceeds the threshold and the timestamp of the first Reading that does not exceed the threshold. In this case, the total time of the exceedance is evaluated as exactly 3 days, which is the time between 2021-06-03 00:00 and 2021-06-06 00:00.
Therefore, both the conditions Count > 1 and Accumulated Time > 3 Days would be false.
Here, you can see that all the Readings evaluated exceed the threshold. In this case, the values are treated as a single occurrence of the exceedance and the time for which the exceedance occurs is evaluated as the difference between the timestamps of the first and last Readings, even though the exceedance is ongoing. In this case, the condition Count > 1 would be false and the condition Accumulated Time > 3 Days would be true.
Predix Essentials applies the same principle whenever the first or last reading evaluated exceeds the threshold. Consider the following graph:

Here you can see that the first three Readings exceed the threshold, the next Reading is below the threshold, and the last two readings are above the threshold. In this case, there are two separate exceedances, and the total time for which the threshold is exceeded is evaluated as 4 days, comprised of 3 days for the first exceedance and 1 day for the second exceedance. Therefore, the condition Count > 1 would be true and the condition Accumulated Time > 3 Days would be true.