Policy Execution
About Policy Execution
- Automatic execution
- Scheduled execution
- Manual execution
- You can execute only the active instances associated with active Policies.
- The policy execution log can grow quickly and significantly impact the size of the Predix Essentials database. You can control how quickly the execution log grows by modifying the execution history settings for each policy.
Automatic Execution
When automatic execution is configured, individual Policy instances are executed when records belonging to the Policy instance are updated. Additionally:
- For records represented by a Measurement Location, OT Connect Tag, or Health Indicator node, Policy execution is also triggered by changes in related Reading records in the APM database.
- For process historian tags represented by an OT Connect Tag node, Policy execution is also triggered when new readings are added in the process historian.
Automatic execution works in conjunction with the selection in the Trigger check box that appears on the Properties window for all Input nodes except Query, Constant, and Point Value nodes. When the Trigger check box is:
- Selected: Changes in a record or related readings represented by the node will trigger Policy execution. The Trigger check box is selected by default.
- Cleared: Changes in a record or related readings represented by the node will not trigger Policy execution.
For example, you have a Policy that contains an Entity node that represents an Equipment record, but the Entity node does not influence any of the logic in the Policy model that determines if action is needed. Rather, other Entity nodes (for example, representing Measurement Location records that are linked to the Equipment record) influence the actual logic in the Policy model. In this case, you can exclude the associated Equipment record from triggering the Policy execution by clearing the Trigger check box for that node. By doing this, only the changes in the relevant records will trigger Policy execution.
When Should Automatic Execution Be Used?
Use automatic execution when the Policy is designed to monitor one or more values that change with time and when an action is needed in response to a specific change. Consider the following examples:
- The Policy monitors readings related to an OT Connect tag. When a reading value crosses a defined threshold, the Policy creates or closes a Policy event.
- The Policy monitors the status of a Health Indicator record. When the Health Indicator enters the Alert state, the Policy sends an email to the responsible user.
Scheduled Execution
When scheduled execution is configured, all active instances that are associated with a Policy are executed according to the schedule that you define.
When Should Scheduled Execution Be Used?
Use scheduled execution when the Policy is designed to evaluate data over a period or when automatic execution could produce misleading results.
Consider the following examples of Policies designed to evaluate data over a period:
- Using the Threshold Statistics node, the Policy analyzes threshold excursions during the previous month for values related to an OT Connect tag or Health Indicator.
- The Policy evaluates conformance to an asset strategy by comparing the actual count of readings added for a measurement location within the previous week to the expected count.
Consider the following example of a Policy monitoring values where automatic execution could produce misleading results:
The Policy evaluates combined information from a Rounds Route that includes multiple measurement locations for a single asset.Because mobile users can enter readings in any order and could change a previously entered reading value before finalizing the Route, using automatic execution in this scenario could trigger executions where one or more readings are from an earlier Route execution or are otherwise invalid.
Instead of using automatic execution, the Policy could be scheduled to run at a similar frequency to the Route. For example, if the Route is completed during the morning shift on weekdays, the Policy could be scheduled to execute after the end of the shift. The Policy checks whether new Readings have been added for all the required inputs before proceeding with the evaluation of the results.
Considerations for Scheduled Policies
You can take steps to prevent delays in Policy execution by considering the number of Policies you are scheduling and the number of instances associated with each.
When scheduling multiple Policies, you can configure the Policy for different schedules so that the executions are staggered throughout the day.
All active instances of a scheduled Policy are submitted for execution at the same time. Therefore, when scheduling a Policy with a large number of instances, you can stagger the executions by creating multiple copies of the Policy, each with a subset of the instances. You can then schedule each of the Policies to be executed at a different time. This approach may be especially advantageous when users are located in multiple time zones, as you could configure relevant Policy instances to be executed outside of normal business hours such that results are available in different locations as needed.
Manual Execution
If a Policy is active, you can manually execute the Policy irrespective of the configured execution settings. You can execute an active instance or all the active instances associated with the Policy. If you manually execute a Policy, the execution settings configured for the Policy are not changed and the Policy continues to be executed according to the configured settings.
When Should Manual Execution Be Used?
If you want the Policy to trigger the specified actions once without changing the existing execution settings that are configured for the Policy or configuring additional one-time scheduled execution settings, you can use the manual execution method.
- Sending an email
- Creating an Alert
For example, you designed a new Policy for an electric motor such that if the working temperature of a motor exceeds 800 K, an email notification will be triggered to the related engineer. You created two instances for the Policy and activated them without activating the Policy. Based on the requirement of the Policy, you configured it for automatic execution. Now, if you want to verify if the newly created Policy correctly triggers the required email notification, you must additionally configure the Policy for a one-time scheduled execution and activate the Policy. In this scenario, you can manually execute the Policy and verify if it triggers the correct action, instead of configuring additional one-time execution settings.
About Active Policies and Policy Instances
When a policy is active, the active instances that are associated with the policy will be executed according to the execution settings defined for the policy.
Consider a policy with two instances, where one instance is active and another instance is inactive.
- If the policy is active, the active instance will be executed according to the execution settings defined for the policy.
- If the policy is inactive, neither of the policy instances will be executed. However, the active instances associated with an inactive policy can be executed if the policy is manually executed and is not according to the pre-configured execution settings.
If a policy is active but does not contain an active instance, a warning message appears in the notification bar, indicating that there are no active instances to execute.
Configure Scheduled Execution
Before You Begin
- Run the validation process to confirm that the policy logic is working correctly.
- Verify that the correct time zone is specified for the policy.
About This Task
Procedure
- In the Details workspace, in the Execution Settings section, select the Scheduled Execution check box.
Options that you can use to specify the schedule appear.
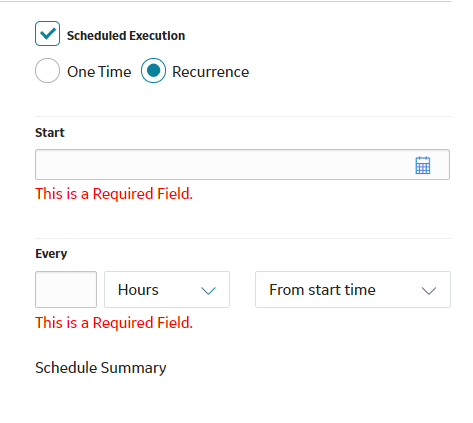
- On the toolbar, select
 .The policy is saved. A summary of the schedule and the next date on which the policy will be executed appears below the schedule settings.
Results
What To Do Next
Configure Automatic Execution
Before You Begin
- Run the validation process to confirm that the policy logic is working correctly.
About This Task
Procedure
Results
What To Do Next
Execute an Active Instance Manually
Before You Begin
- Run the validation process to confirm that the policy logic is working correctly.
About This Task
You can manually execute an active instance or all the active instances associated with a Policy. This topic describes how to execute a specific active instance associated with a Policy.
Procedure
- In the Design workspace, select the Instances tab.The Instances section appears.
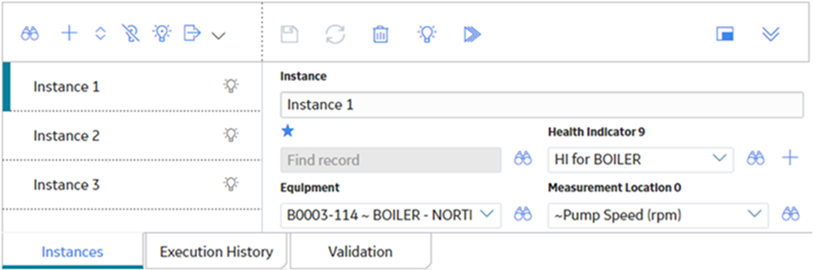
- Select
 .Note: is enabled only for the active instances of a Policy.The instance is queued for execution.
Execute all Active Instances Manually
Before You Begin
- Run the validation process to confirm that the policy logic is working correctly.
About This Task
You can manually execute an active instance or all the active instances associated with a Policy. This topic describes how to execute all the active instances associated with a Policy at once.
Procedure
Activate or Deactivate a Policy
Before You Begin
- Run the validation process in order to confirm that the policy logic is working correctly.
- Configure the execution settings for the policy.
Procedure
- In the Details workspace, on the toolbar, either the
 button or the
  button is displayed.
- If the button is displayed, the policy is active. To deactivate the policy, select this button.
- If the button is displayed, the policy is not active. To activate the policy, select this button.
On the button and on the Details tab, the active/inactive indicator changes to reflect your selection.
- If the
Results
- If you activated the policy, the active policy instances that are associated with the policy will be executed according to the policy's execution settings.
- If you deactivated the policy, none of the policy instances that are associated with the policy will be executed.
What To Do Next
Configure Policy Execution History Log Setting
About This Task
You can configure the policy to determine when execution history log records will be created.
Procedure
- On the toolbar, select
The policy is saved. The execution history log setting is applied to subsequent policy executions.
Access Execution History
Procedure
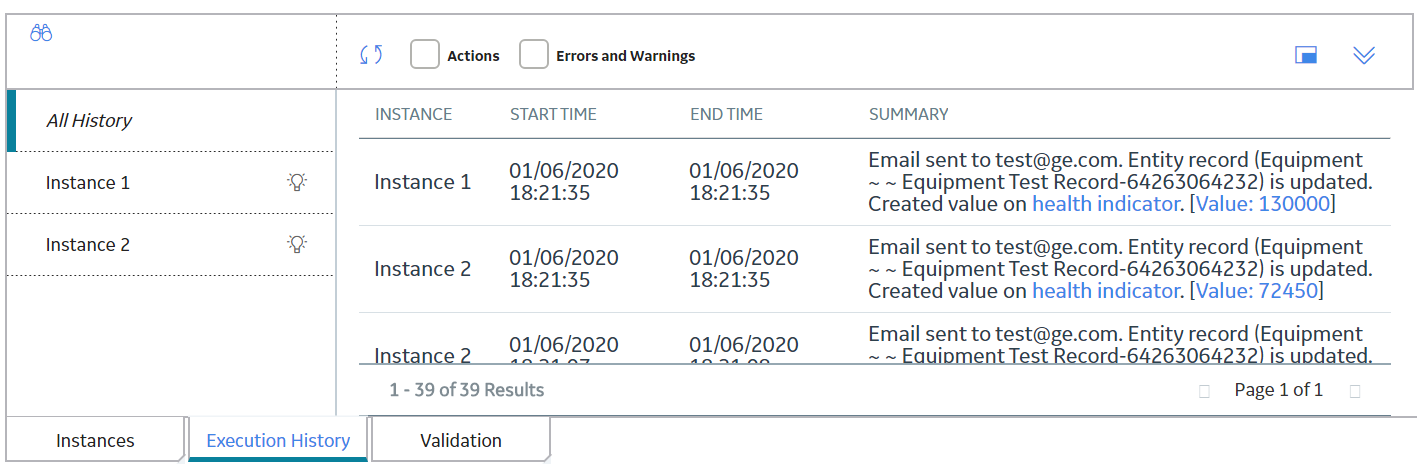
- In the Design workspace, select the Execution History tab.The Execution History pane appears. On the left side of the pane, a list of the policy's instances appears. On the right side of the pane, execution summaries for all policy instances appear.
 Tip:
Tip:- To resize the pane, drag the top edge of the pane.
- To maximize the pane, select
 .
. - To restore the pane to its original size, select
 .
. - To close the pane, select
 .
.
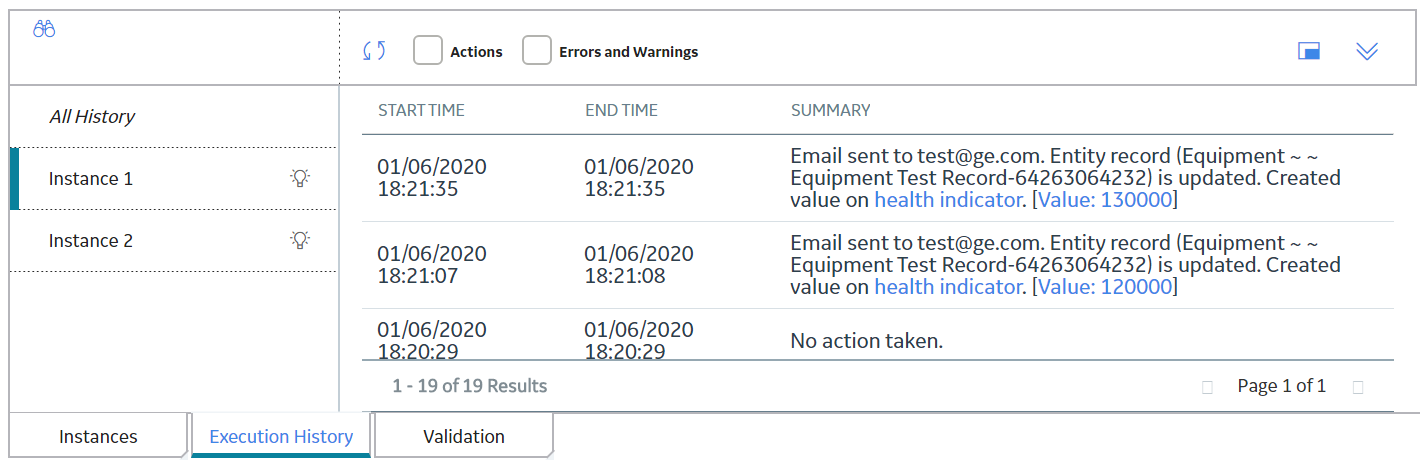
- On the left side of the pane, select a policy instance.On the right side of the pane, a summary of the execution results for the selected instance appears.
Monitor Policy Execution
About This Task
When you execute a policy, a notification is sent to the policy trigger queue. A policy trigger service processes the requests and sends a message to the policy execution queue. A policy execution service processes this message and executes the policy. Depending on the load on the policy execution service, the start time of the policy execution varies.
The policy execution history contains the time that the notification was sent to the policy trigger queue, the execution start time, and the execution end time for each policy execution.
You can monitor the average and maximum wait times and review recent policy executions on the Policy Designer Overview page and the Recent Policy Executions dashboard.
Procedure
- To view policy execution details on the Policy Designer Overview page:
- Access the Policy Designer Overview page.
- Access the AVERAGE AND MAX WAIT TIMES IN QUEUE FOR 15 MIN INTERVALS IN LAST 4 HOURS Graph.
- To view policy execution details on the Recent Policy Executions dashboard: