 Historian
Windows
Windows
The following sections describe windows that you can use with the application.
Chart Editor window Description
The following elements describe the Chart Editor window.
| Number | Component | Description |
|---|---|---|
 | Select Series | The Select Series field contains a drop-down menu that lists all the tags in the chart. You can select any of the tags listed. |
 | Type | Changing the Type changes the way the highlighted tag in the Select Series field displays in the chart. Type includes: Line, Area, Scatter, and Statistics. For more information, refer to Chart Type Options. |
 | Color | A different color is used for each legend in chart. You can change the line color for each tag on your chart or the line color of the bell curve in a histogram by choosing a new color from the 18 pre-existing colors or accept the color that the system provides. You can also use the Color option to change the color of the bins in a histogram chart. |
 | Auto Scale | Auto Scale allows you to enable or disable automatic scaling of your chart. When you disable Auto Scale, the system allows you to specify the minimum and maximum range of values for the chart to display. By default, the Y-axis scales to the low and high points found within the Historian data sample. To set your own scale, slide the icon to the right (it should turn gray) and enter your own low (Min:) and high (Max:) points for the Y-axis. |
Chart Type Options
Changing the Type changes the way the highlighted tag in the Select Series field displays in the chart. Type includes: Line, Area, Scatter, and Statistics.
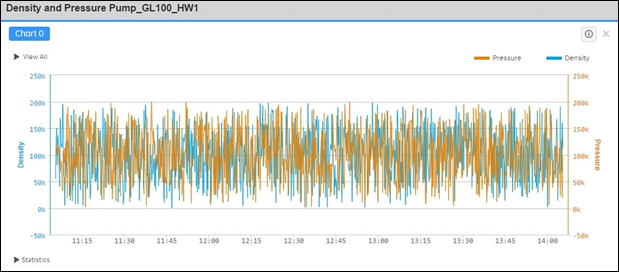
Line
Line is the default Type. When you select Line, a line chart appears similar to the following.
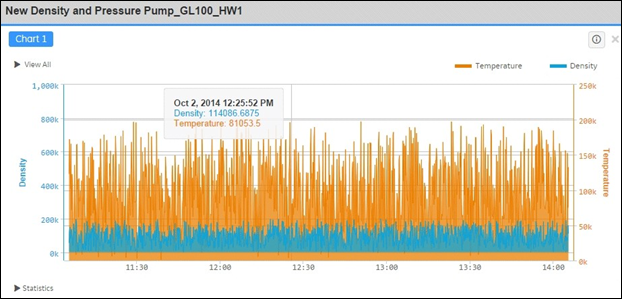
Area Chart
When you select Area as the Type, your chart appears similar to the following.
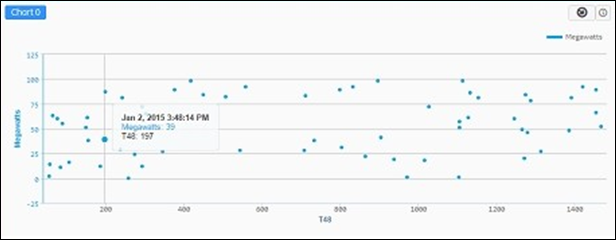
Scatter Chart
When you select Scatter as the Type, a chart similar to the following appears.
Statistics Chart
The Statistics chart displays as a box and whisker plot, and displays the maximum, minimum, average, standard deviation, and data sample counts within the interval determined in the Historian Sampling Mode for the chart. (You can view the statistics by hovering your cursor over the tag.)
When you select Statistics as the Type, a chart similar to the following appears.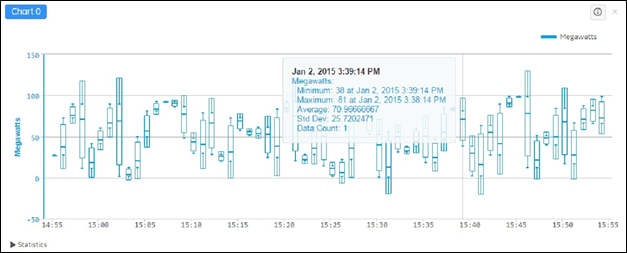
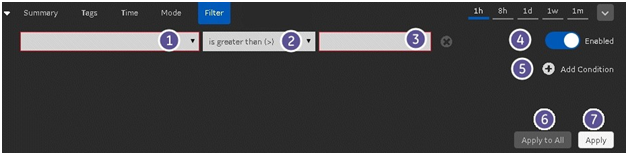
Filter Editor window
The Filter Editor window allows you to add or modify a condition by which to filter data from a Historian server. The data displays in your charting session.
Filter Editor window Description
The following describes the Filter Editor window elements.
| Number | Component | Description |
|---|---|---|
| Tags | Contains a list of active tags that have been added to the analysis session. |
| Operators | Contains the available operations. These include: is equal to (=), is less than (<), is less than or equal to (<=), is greater than (>), is greater than or equal to (>=). |
| Value | Lets you enter a value for the condition. |
| Enabled/Disabled Filter Switch | Lets you enable or disable the filter. Select the Apply to All or Apply button to apply changes to the state of the filter switch. |
 | Add Condition | Allows you to add a new condition. |
 | Apply to All | Applies the filter changes to all relevant analysis objects. |
 | Apply | Applies the filter to only the analysis object selected. |
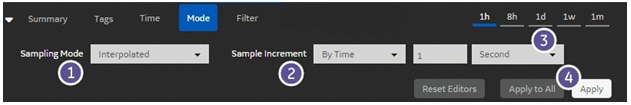
Mode Editor window
The Mode Editor window allows you to modify the way you request and display Historian tag values by first selecting a Historian Sampling Mode from a drop-down menu and then configuring the options that appear for that node. You can apply the mode to the currently selected chart or to all charts.
Mode Editor window Description
The following elements describe the Mode Editor interface.
| Number | Component | Description |
|---|---|---|
| Sampling Mode |
Sampling modes include the following:
Note: The default mode for the first chart you create uses the Interpolate mode with a sample size of 1000. See your System Administrator to increase the sample size. Please refer to the Historian product documentation for an explanation of Sampling Modes.
|
| Sample Increment | The sample increment for all modes, except Calculated, is either:
By Size or By Time. When you
select By Time, an additional window appears. When you select the Calculated sampling mode, an additional Calculation drop-down menu provides you with a list of the following associated selections:
Please refer to the Historian product documentation for an explanation of Calculation Modes. |
| By Time | This window appears only when you select the Sample Increment. By Time increments appear in a drop-down menu that contains:
|
| Apply Apply to All | Applies the time selections to only the object selected. Applies the time selections to all relevant objects. |
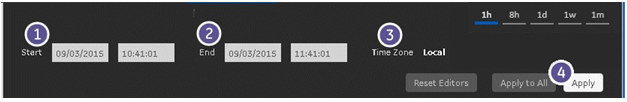
Time Editor window
The Time Editor window allows you to configure the time range for which you want to view data within a chart by entering a start and stop time. For more information on setting time, refer to Configure Time.
- The default Start time for the first chart you create is the previous hour (1-hour relative time default).
- The clock is not active when you leave the Analysis section open and time elapses until you start creating charts. For example, if you open the Analysis section and walk away from your computer for an hour and then create a chart, your chart will be "Stale" as the time period for the fetch is defined by the Start and End time in the editor. This becomes apparent if you also create a Value Card or Current Value Table with the same tag. The values and timestamps will be off by an hour.
Time Editor window Description
The following elements describe the Time Editor window.
| Number | Component | Description |
|---|---|---|
| Start (Date-Time) | Lets you select the starting date and time for the data range. |
| End (Date-Time) | Lets you select the ending date and time for the data range. |
| Time Zone | Indicates the time zone. Your System Administrator configures the time zone as either Local or UTC within the System Config section accessible by selecting the Admin drop-down menu and then selecting Administration. |
| Apply Apply to All | Applies the time selections to only the object selected. Applies the time selections to all relevant objects. |
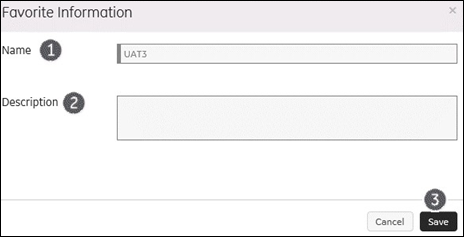
Favorite Information window
The Favorite Information window allows you to enter the name and description of the Favorite before you save it.
Favorite Information window Description
The elements for the Favorite Information window are described in the following table.
| Number | Component | Description |
|---|---|---|
| Name | Allows you to enter a name for the new favorite. Specify a unique name. By default, your Session title is the name of your Favorite until you change it. Note: Special characters are not allowed in this field. |
| Description | Allows you to enter a description for the new favorite. Note: Special characters are not allowed in this field. |
| Save Cancel | Saves the Favorite with the name and description you have entered. Cancel this window. |


