 Historian
User Interface
About the Trend Client User Interface
The main user interface consists of a single panel or window and appears similar to the following illustration. The main user interface includes editing options and a main display.

| Number | Component | Description |
|---|---|---|
 |
Favorites Panel | Provides access to your stored Favorites list, in alphanumerical order, and access to the Favorites Action Menu. |
 |
Summary Editing options | Provides options to search for and select the Historian tags you want to work with, and define the time period, Historian query mode, and filtering to impact the charts and tables you create in your main display. |
 |
Help | Opens this help system. |
 |
Admin | Provides a drop-down menu with the following options:
|
 |
Main Display Area | Allows you to create trend charts, current value tables, and current value cards that contain tag information, and text objects to explain your analysis. Options exist to export your data to a CSV file and to modify how you view and print your display. |
Editors and Display Area
The user interface provides editors that allow you to create and modify trend charts and histogram charts, tables, and value cards as well as defining the Historian sampling mode and specific filters for requesting and displaying Historian tag values, and a main display area where you can view your output.
There are a number of options to help in creating and managing displays.

Editors and Tools Area Description
The elements for the Analysis section interface are described in the following table.
| Number | Component | Description |
|---|---|---|
|
Down Arrow | Toggles the expansion or collapse of the editor section. |
|
Summary | Displays the tags, time, mode, and filter for the item you selected. By default, the Summary view appears when you open the application. |
|
Tags | Provides a Historian tag search and selection capability and then lists the
tags that you have selected to use in your displays (active tags). You can add
any of these active tags in displays that include trend charts, value cards,
current value tables, text boxes, and filters. When you use a tag in a current value table, value card, or a trend chart a blue dot appears before the tag name indicating it is in use for the selected object. |
|
Time | Allows you to configure the time range for which you want to view data within a chart by entering a start and stop time. Your System Administrator configures the time zone as either Local or UTC within the System Config section accessible by selecting the Admin drop-down menu and then selecting System Config. The default is the last hour. |
|
Mode | Allows you to modify the way you request and display Historian tag values
by first selecting a Historian Sampling Mode from a drop-down menu and then
configuring the options that appear for that node. You can apply the mode to the currently selected chart or to all charts. The default is Interpolated, 1000 samples. |
 |
Filter | Allows you to modify a condition by which to filter data from a Historian
Server. You can choose to apply the filter to the current analysis item or you can Apply to All items in the Analysis session. This results in a new query to Historian and only the data that meets the filter criteria is returned to the chart. The default is no filter. |
 |
Quick Time Picker | Provides an easy way to modify time in your charts. You can change the
X-axis for a time-based chart by opening the chart and then selecting the
Time of your choice. The following Quick Times are
available:
|
 |
Reset Editors | Allows you to reset all editors including Tags, Time, Mode, and Filter editors. It is not available from the Summary page. |
 |
Apply Apply to All |
Note: If there is a validation error in the Time Editor,
then the Apply and Apply All
buttons will be disabled.
|
Main Display Area
The main display area provides icons to create analysis element and allows you to view these elements on your page.

Analysis Display Area Description
| Number | Analysis Item | Description |
|---|---|---|
| Title | Provides a name for the whole display. Note: Commas are not permitted in the Title. |
| Toolbar icons | Consists of the following four tool icons:
|
| Save as Favorite | Allows you to save your current display as a Favorite. You can enter a name and destination to save the display area and to name it as a Favorite. Allows you to save the current main display area and name it as a Favorite. |
| Action Menu | Provides additional functions for your main display. |
| Display Area and Icons | Provides an area to build your displays by adding items (trend charts, current value tables, value cards, or text box) to the display area. For example, when you drag-and-drop a tag from the listing of tags (or search results) to an analysis item icon, it displays in the display area. Icons are similar to those in the toolbar and include the following:
|
 Adds an empty trend chart.
 Adds an empty current value table.
 Adds an empty value card.
 Adds an empty text box.
Editing Options Area
The Editors and Tools areas allow you to create and modify trend charts, and define the Historian Sampling Mode for requesting and displaying Historian tag values, and create filters. It contains the following:
- Summary
-
The Summary displays the Tags, Time, Mode, and Filter for the item you selected. By default, the Summary appears when you open the application.

- Tags
-
The Tags display area lets you search for Historian tags to use and then lists the tags that have been added for use (active tags). Search is a Google-like search engine that browses for Historian tag names based on any free-text you type in (no wild cards are used). You can then select and add tags (active tags) for use in a chart, current value table, or current value card. A scroll bar appears on the right side of the display to allow you to view and select tags. When you use a tag in a current value table, value card, or trend, a blue dot appears before the tag name in the list to indicate it is in use. You can select on the circled i to the right of the tag name to get additional tag information (Tag Name, Tag Description, Source, and EGU Description as captured in Historian).

- Time Editor
The Time Editor allows you to configure the time range for which you want to view data within a chart. By entering the Start and End times, you select the time range of data that is fetched from Historian and is available.

The Time Editor displays the time zone as either Local or UTC. Your system administrator can configure the time zone in the System Config section, which is accessible by selecting the Admin drop-down menu and then selecting Administration.
The default End time is NOW (current time) and the Start time is NOW minus 1 hour.Note:- The default Start time for the first chart you create is the previous hour (1-hour relative time default).
- The clock is not active when you leave the Analysis section open and time elapses until you start creating charts. For example, if you access the Analysis section and walk away from your computer for an hour and then create a chart, your chart will be "Stale" as the time period for the fetch is defined by the Start and End time in the editor. This becomes apparent if you also create a Value Card or Current Value Table with the same tag. The values and timestamps will be off an hour.
- Quick Time Picker
-
The Quick Time Picker provides you with an easy way to modify time in your charts. You can change the X-axis for a time-based chart by opening the chart and then selecting the time of your choice. The following Quick Times are available: 1 hour, 8 hours, 1 day, 1 week, and 1 month. After you select on a new time in the Quick Time Picker, the new time range loads and displays in the X-axis of the chart.
 The Quick Time Picker is available for trend charts.Note: When you have two charts open and use the Quick Time Picker to change the time in the first chart and then attempt to use the Quick Time Picker to change the time in the second chart, the second chart does not reflect the duration you selected.
 - Mode Editor
-
The Mode Editor allows you to modify the way you request and display Historian tag values by first selecting a Historian Sampling Mode from a drop-down menu and then configuring the options that appear for that node. You can apply the mode to the currently selected chart to all charts.

- Filter Editor
-
The Filter Editor allows you to modify a condition by which to filter data from a Historian Server.

When you select the Add Condition button, a window opens. This window allows you to edit or create a new condition by which to filter. You can choose to apply the filter to the current analysis item or you can Apply to All items in the session. This results in a new query to Historian and only the data that meets the filter criteria is returned to the chart.
Favorites
A Favorite is a way to store common displays that you create. They can include any combination of a list of active tags, charts, tables, value cards and text objects. When saved as a Favorite, charts maintain all editor settings at the time of the save.
The Favourites Panel

| Number | Item | Description | |
|---|---|---|---|
|
Favorites Panel | The Favorites Panel is accessed by selecting the star button in the menu bar. | |
|
 |
Unpin/Pin | Pins or unpins the panel in the display to manage space.
The panel is closed when unpinned, but available from the menu. Select Close to close the panel. When closed, select the Favorites to redisplay the view. In either case, the panel drag control remains available to reopen the panel. |
|
 |
Action Menu | Displays the following options:
|
|
 |
Panel Handle | Lets you drag to increase or decrease the Favorites Panel size. |
|

|
Import/Export Favorites | Allows you to export all your saved favorites as a JSON file that you
can import into a different Historian or provide to another user on the
same Historian. Note: The maximum supported number of Favorites is
100. |
Main Display Panel
The main display area provides a place to create and modify trend charts and tables. In the main display area, you can:
- Add Trend Charts
- Access the Chart Editor
- Add Current Value Tables
- Add Value Cards
- Add Text Boxes
- Save
- Access the Action Menu
Trend Charts
- When there is a validation error in a trend chart, the Apply and Apply All buttons become disabled.
- Trending of string tags is not supported.
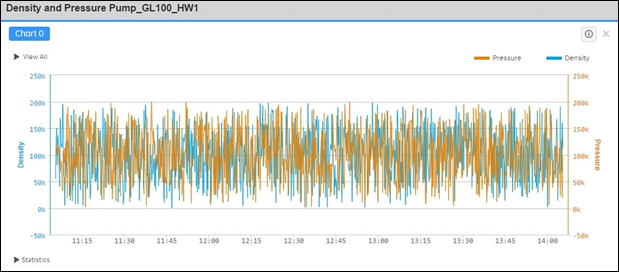
- Line Chart
-
Line is the default Type. When you select Line, a line chart appears similar to the following.
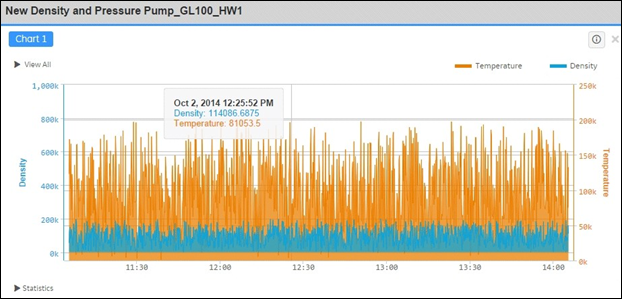
- Area Chart
-
When you select Area as the Type, your chart appears similar to the following.
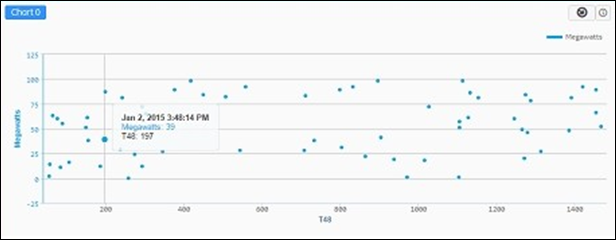
- Scatter Chart
-
When you select Scatter as the Type, a chart similar to the following appears.
- Statistics Chart
-
The Statistics chart displays as a box and whisker plot, and displays the maximum, minimum, average, standard deviation, and data sample counts within the interval determined in the Historian Sampling Mode for the chart. (You can view the statistics by hovering your cursor over the tag.)
When you select Statistics as the Type, a chart similar to the following appears.
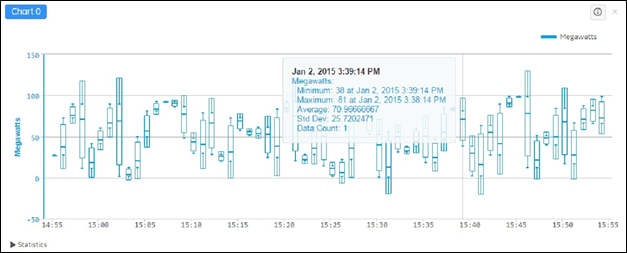
Chart Editor
- Trend Chart Example

- Chart Editor Descriptions
-
The elements for the Chart Editor are defined as follows for both charts.
Number Component Description Session Title Allows you to enter a name for your display session. By default, the title is labeled Select to Add Title until you change it. This will also be the name of your Favorite until you change it. Note: Commas are not permitted in the Title.Chart Title Allows you to enter a name of that specific chart. The Chart title is automatically labeled Chart 0, Chart 1, Chart 2, and so forth until you change it. Summary Information Opens up the Summary Information for that chart. This information moves with your cursor. The information that displays includes the following: - Chart Type
- Start date and time
- End date and time
- Sampling Mode
- Sample Increment
- Tag names included in chart
Delete Deletes the chart without a warning or alert message.
Important: When you select Delete, the chart is deleted without a warning message or confirmation prompt.Legends Displays the tag name and color for each tag. If all the tags in the chart do not fit in one row of the legend, View All appears on the left side of the page. Selecting on the right-facing arrow expands the legend above the chart so that all tag names appear with a color depicting their current line color. Hovering your cursor over a tag and selecting the down-arrow to the right of the tag name exposes options for the tag. Selecting on the tag toggles the visibility of the tag in the chart.
Statistics Exposes the raw Historian tag statistics for each tag in the chart. You can sort any column in this table by selecting on a column header or on the up/down arrow in the header. Selecting on the arrow to the left of Statistics toggles the table below the chart.
- Chart Editor Options
-
- Edit: When you select Edit from the drop-down menu, the Chart Editor window appears. The Chart Editor window allows you to format the Type, Color, and Auto Scale for the tag specified in the Select Series field.
- Switch Y-Axis: Selecting the Switch Y-Axis option allows you to move the Y-axis to the opposite side of the trend chart (right or left). As you continue to add tags to a chart, the Y-axis automatically alternates adding the scale for that tag to the right and left. Use this option to be prescriptive on how your trend chart displays the Y-axis.
- Use as X-Axis: By default, the X-axis represents time. When you select this option from the drop-down menu, it changes the X-axis in the chart. This allows you to determine relationships between tag values. The Undo icon appears in the upper right corner of the page and allows you to revert back to the original X-axis.
- Remove: The Remove option deletes a
tag from your chart.Important: When selecting this option, you do NOT receive a warning or alert message before the tag is removed. To re-add the removed tag, drag the tag back into the chart.
- General Charting Guidelines
-
- You can zoom into a specific chart with a mouse select-and-drag operation. After zooming, you can reset the zoom to its original setting by selecting the Reset Zoom button.
- You can rename the chart by selecting the title text and entering a new name.
- Data compression necessitates initial interpolation or interpolation mode display. Use the Mode function to change your Historian sampling mode.
- Raw data is plotted when you select the Mode as either Trend to Raw, Interpolated to Raw, or Lab to Raw. As you start to zoom in, you will see raw data points as the time interval starts becoming smaller. Historian starts returning raw points if the number of raw points in that interval are less than the sample sizes requested by the system.
- Exporting raw or trended data can be viewed by using the Action menu.
- Auto Refresh Toggle Switch
-
At the top right-hand corner of your chart, you will see the Auto-Refresh toggle switch. Turning this feature on will allow your chart to auto-update when new data comes into Historian providing a ???live chart where old data ???slides to the left as new data samples arrive.Important: When selecting this option, most chart options either have limited or no functionality.Before setting the toggle switch to ON:
- Set Mode to Lab or one of the Calculated Modes.
- Leave Quick Time Picker on 1 hour.
- Use default Line Chart option where time is on the X axis.
- Pre-apply any desired filters.
- The auto-refresh chart will keep your chart updating, but at some point (12 hours by default) your UAA token will expire. You may need to close your browser and log back into the application if you wish to use other features after keeping the auto-refresh chart as the active chart for long periods of time.
- When using multiple tags in an analysis session, a Content Refresh Interval rate of 30 seconds or higher and a Sampling Increment of 30 seconds or higher is recommended; however, these values cannot be the same. For example, the Content Refresh Interval can be set to 30 seconds and the Sampling Increment can be set to 20 seconds.
- Supported Functions
-
Editing Options area
- Summary: Works as expected.
- Tags: Works as expected.
- Time: Can???t edit Start and End times. End time is fixed at current time.
- Mode: Only Lab or Calculated modes are accepted. As the default is set to Interpolated, you must change your mode to either Lab or Calculated mode before your chart will auto refresh.
- Mode: Sample Increment must be by Time and the Time Sample value must be less than the Current Refresh Interval set in the Admin drop-down menu, under System Config.
- Filter: Pre-existing filter conditions will apply. No new filters can be applied while the Auto Refresh setting is on.
- Quick Time Picker: You will not be able to select a quick time option when the number of samples exceed the pre-set allowable limit (5000 samples).
Chart Editing Options- Switch Y-Axis works as expected.
- Use as X-Axis may work but provides inconsistent results and is not recommended.
- Hiding a tag by selecting on it works as expected, as does re-selecting to have the tag re-appear.
- Line chart types are your best option. Area does not work.
- Scatter works as expected.
- Color works as expected.
- Auto Scale does not work.
Miscellaneous Options- Statistics also works as expected, and are auto refreshed with each new data sample that arrives.
- Summary information works as expected.
- Delete works as expected.
- Action Menu works as expected.
- Favorites works as expected.
- Zoom does not work.
- Auto Refresh Guidelines
-
- Choosing a unit smaller than one second generates large amounts of returned data. The system calculates the expected return size and prevents you from requesting an amount larger than the maximum size specified in the Analysis Sample Size Limit in the System Configuration subsection in the Other Preferences section.
- Auto-Refresh is Memory and CPU intensive. For best results, follow the Sizing Guidelines for minimum equipment specifications found in the Getting Started Guide.
- If you delete the last tag in a chart that is running Auto-Refresh, then Auto-Refresh automatically is disabled (Off) for that chart.
Viewing Auto-Refresh on Mozilla Firefox- In the Firefox address bar, type
about:config and press
Enter.
The This might void your warranty warning page appears.
- Select I'll be careful. I promise!
The about:config page appears.
- Search for the Preference Name
dom.max_script_run_time, and select
it.
The Enter Integer Value pop-up box appears.
- Type 30 and select OK.
Setting Firefox Preferences to Default Values- In the Firefox address bar, type
about:config and press
Enter.
The This might void your warranty warning page appears.
- Select I'll be careful. I promise!
The about:config page appears.
- Search for the Preference Name
dom.max_script_run_time, and select
on it.
The Enter Integer Value pop-up box appears.
- From the drop-down menu that appears, select Reset.
Current Value Table
The Current Value Table inserts a snapshot of the table of the most current Historian value for the tag(s) you drag into it.

| Number | Component | Description |
|---|---|---|
|
Title | Allows you to enter a name for your Current Value Table. By default, the title is automatically labeled Current Value 1, Current Value 2, Current Value 3, and so forth until you change it. |
|
Remove Selected | Deletes the selected tag from the Current Value Table. |
|
Filter | Type any text to dynamically and quickly filter your view based on desired criteria. This impacts all columns. |
|
Name | Lists the Historian tag name of the tags you selected in the Current Value Table. |
|
Time | Contains the time stamp from Historian based on a current value query, meaning that it is the most current value and its time stamp based on what is in the Historian. |
|
Value | Lists the most current value in Historian for the selected tag. |
|
Quality | Indicates the quality of the tag (Good or Bad) as it receives it from Historian. |
|
Units | Lists the EGU Description for the tag as captured in Historian. |
|
Description | Lists the Description for the tag as captured in Historian. |
 |
Display Number | Lets you select the number of entries to display without pagination in the Current Value Table (maximum of 7). |
 |
Page Selector | Allows you to select which page to display when there is more than one page available. |
Value Card

| Number | Component | Description |
|---|---|---|
|
Title | Allows you to enter a name for your Value Card.
By default, the title is automatically labeled Value Card
1, Value Card 2 and so forth until
you change it. This Value Card Title is used as the
name for your Favorite when you select Save (or
Save As). Note: Commas are not permitted in the
Value Card Title. |
|
Name | Lists the Historian tag name of the tags you selected. |
|
Timestamp | Contains the time stamp from Historian based on a current value query, meaning that it is the most current value and its time stamp based on what is in the Historian. |
|
Value | Lists the most current value in Historian for the selected tag. |
|
Unit of Measure (UoM) | Lists the EGU Description for the tag as captured in Historian. |
|
Description | Lists the Description for the tag as captured in Historian. |
Text Box

| Number | Description |
|---|---|
|
Bold text. |
|
Italic text. |
|
Underline text. |
|
Reset the selected text to normal. For example, it removes bold, italics, or underlining from the text. |
|
Bullet list. |
|
Numbered list. |
|
Left justified. |
|
Center justified. |
|
Right justified. |
|
Attach a hyperlink to the URL that you specify. |
|
Remove a hyperlink. |
 |
Go back. |
 |
Go forward. |
Save
The Save button allows you to save an item as a Favorite. When you select the Save button, the Favorite Information window appears and lets you select a name for this favorite as well as a location and description. By default, your Session Title is the name of the Favorite until you change it.
Action Menu

| Number | Item | Description |
|---|---|---|
|
Save As | Opens the Favorite Information window and allows
you to save your analysis session as a new Favorite with a new name. You can
save the session using a unique name of your choice. Note: When saving the
analysis session, commas are NOT permitted in the title for the analysis
session; however, commas are permitted in a Chart
title. |
|
Select All | Selects all the items in the main display. |
|
Export Raw Data | Exports the raw data from a chart for the time range to a CSV file. |
|
Export Trend Data | Exports the trended data from a chart to a CSV file as defined by the Historian Sample Mode and any filters for the selected time period. |
|
Preview Page | Opens a Print Preview window and allows you to
view the whole analysis session. From this window, you can
Print the page or Close
the file. Note: When you create charts and select to display them in
Stacked View or Column
View in any browser, selecting Preview
Page displays the charts in Normal
View and does not show the charts in
Stacked or Column
View. |
|
Normal View | Provides a standard display of the elements in your main display area. |
|
Column View | Configures the elements in your main display by removing the legends and statistics, and displays vertically with two elements in each row. When a new element is added, it appears in Normal View. When a second element is added, it automatically conforms to Column View. While in Column View, you can edit the title of the element. |
|
Stacked View | Configures the charts in a session by removing the legends and
statistics. If no charts are in the view, then Stacked
View is empty. Important: Only trend charts are
presented in Stacked View. All other components,
such as value cards, tables and so forth, do NOT display. When you
choose Stacked View on a layout that has
components other than charts, Stacked View will
only display the charts. Use Normal View to
display all other components. |
|
Clear Analysis | Deletes all items within your main display after you confirm this action. |
The Admin Section

| Number | Component | Description |
|---|---|---|
|
Home | Opens the runtime page where you can perform charting actions. |
|
System Config | Allows you to manage your system configuration for this application. |
|
Logout | Lets you exit this application. |
System Configuration Tab

| Number | Component | Description |
|---|---|---|
|
Content Refresh Interval | Determines when a refresh of displayed content occurs, for example the
display of alerts. Decreasing the interval can cause an increased server
load. Based on the requirement for refreshed client data for users, adjust
the interval to longer periods if less frequent display updates are
acceptable. The default is 15 seconds. |
|
Time Zone | Allows you to set the time zone as Local or Coordinated Universal Time (UTC). When set to Local, client users will see Historian tag time and time-based charts (trends) displayed in their client computer time. Setting to UTC will display based on UTC. The default is Local time zone. |
|
Analysis Sample Limit | Specifies the maximum number of samples that can be trended on a chart. |
|
Download Window <number> Days (Maximum) | Indicates the maximum number of days for exported data. The maximum value is 30 days. |
|
Download Limit | Indicates the number of data points you can export. The maximum value is 100,000 data points. |
|
CSV Delimiter | Specifies the delimiter you want to use when you export chart data to a CSV. |
Help
Selecting  in the upper right corner
of the main interface opens this Help application.
in the upper right corner
of the main interface opens this Help application.
Logout Tab
When you select Logout in the Admin section, the system immediately logs you out of the application. For more information on logging in and logging out, refer to Logging In and Logging Out.


