 Historian
Access a Collector Instance
Procedure
- Access Configuration Hub.
-
In the NAVIGATION section, select
Collectors.
A list of collectors appears, displaying the following columns:
Column Description COLLECTOR NAME The name of the collector instance. If you select the link in this column, the details of the collector instance appears. STATUS The status of the collector. Contains one of the following values: - Started
- Stopped
- Running
- Paused
CONFIGURATION The source of the tag configuration for the collector. Contains one of the following values: - HISTORIAN: Indicates that tags are configured using Historian Administrator.
- OFFLINE: Indicates that tags are configured using an offline configuration file.
MACHINE The name of the machine on which the collector is installed. VERSION The version number of the collector. REPORT RATE The average rate at which the collector is sending data. This is a general indicator of load on the collector. OVERRUNS The total number of data events not collected. In normal operation and under normal conditions, this value should always be zero. If the value is not zero, which indicates that data is being lost, you must take steps to reduce peak load on the system by increasing the collection interval. COMPRESSION The effectiveness of collector compression. If the value is low, you can increase the compression deadbands to pass fewer values and thus increase the effect of compression. OUT OF ORDER The total number of out-of-order samples for the collector. REDUNDANCY Indicates whether collector redundancy is enabled, which decreases the likelihood of lost data due to soft- ware or hardware failures. For information, refer to Collector Redundancy. TAG COUNT The number of tags for which the collector collects data. COMMENTS The comments that you have entered for the collector. Tip: You can filter the collectors by the system name.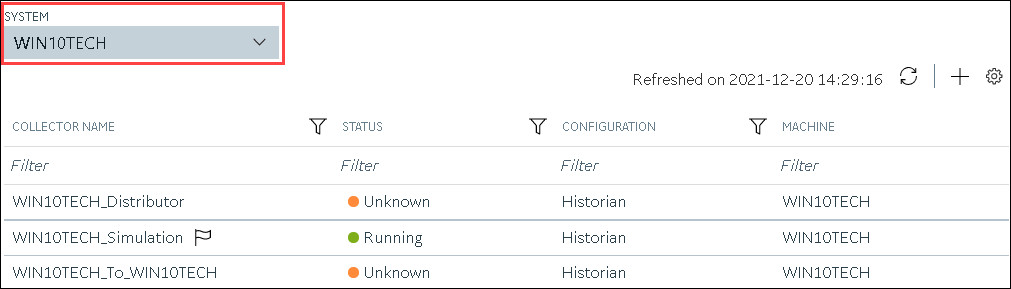
You can also add, reorder, and remove columns from the table. For instructions, refer to Common Tasks in Configuration Hub. -
Select the row containing the collector whose details you want to access.
The details of the collector appear in the DETAILS section.Note: If the DETAILS section does not appear, in the upper-right corner of the page, select
 , and then select
Details.
, and then select
Details. -
If you want to access the collector performance, right-click the collector (or
select
 ), and then
select View Collector Performance.
), and then
select View Collector Performance.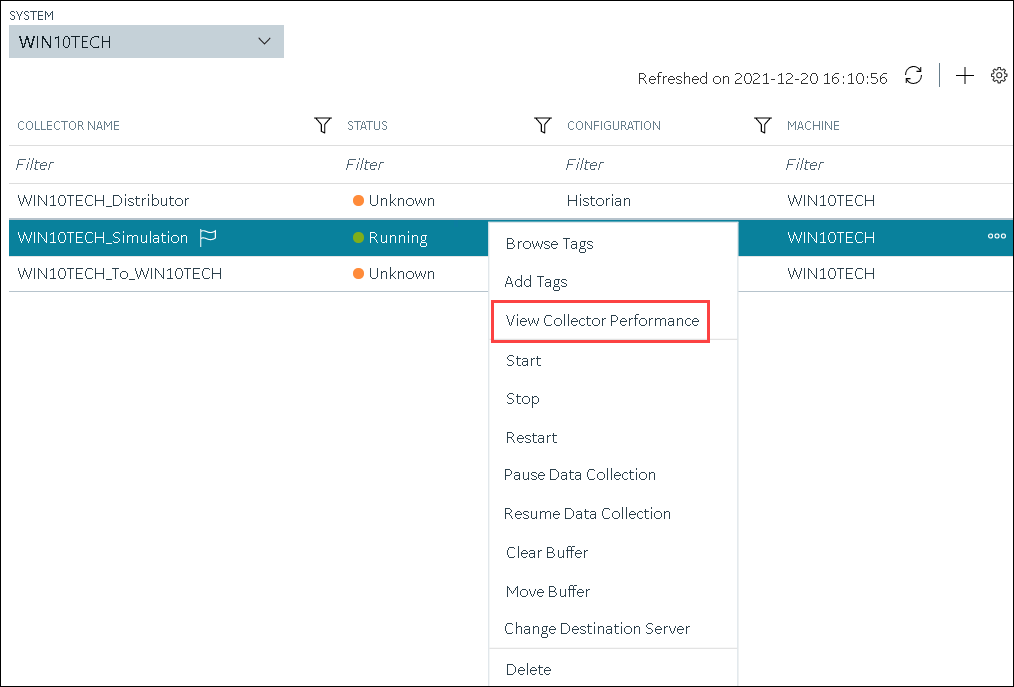
The Collector Performance section appears, displaying the following graphs:- REPORT RATE: The rate at which the collector collects data.
- TOTAL EVENTS REPORTED: The total number of events reported to the Historian archive from the collector. This number may not match the total events collected due to collector compression.
- STATUS: The status of the collector plotted at regular intervals.
- COLLECTOR COMPRESSION: The collector compression (in percentage) applied to tag values plotted at regular intervals.
- OUT OF ORDER: The number of samples that have been received out of sequence. Even though data is still stored, a steadily increasing number of out-of-order events indicates a problem with data transmission that you should investigate. For example, a steadily increasing number of out-of-order events when you are using the OPC Collector means that there is an out-of-order between the OPC server and the OPC collector. This may also cause an out-of-order between the OPC collector and the data archiver but that is not what this graph indicates.
- OVERRUNS: The number of overruns in relation to the
total events collected. Overruns are a count of the total number of data
events not collected on their scheduled polling cycle. An overrun occurs
when the data source is changing tag values faster than the collector
collecting values, which causes it to consistently remain behind the
archiver updates. It implies that the collector is running against the
hardware and/or network limits and you may consider partitioning the
tags into two or more sets, each with separate collector instances.
In a normal operation, this value should be zero. You may be able to reduce the number of overruns on the collector by increasing the tag collection intervals (per tag).
- MINIMUM EVENT RATE: Specifies the minimum number of data samples per minute sent to the archiver from all the collector instance.
- TOTAL EVENTS COLLECTED: The total number of events collected from the data source by the collector instance.
- MAXIMUM EVENT RATE: Specifies the maximum number of data samples per minute sent to the archiver from all the collector instance.