Gauge Linear
The plugin is available under . When designing application pages, drag-and-drop gaugeLinear to a container.
Gauge Linear Properties
| Field Name | Description |
|---|---|
| Source > Input Value | To get values for gauge linear from a data source, use any of these
options:
|
| Source > Minimum Value | Sets the minimum scale value. |
| Source > Maximum Value | Sets the maximum scale value. |
| Use Raw Format | Select the check box to display numbers in raw format. For example, a numeric value with 5 or more decimal places is shown as it is, and not rounded off. |
| Number of decimals | This option appears if you do not want to display numbers in raw
format. In that case, enter the decimal places (0-7) to consider after the decimal point to format large numbers. Based on the decimals, the value is rounded off to the nearest whole number. |
| Advanced Settings |
|
| Range(s) | You can specify one or more ranges to to display in a different color.
|
| Hidden | Select this check box if you want to hide the
plug-in. To show the hidden plug-in in Operations Hub new layout, go
to Page Visuals and under
Action column, select |
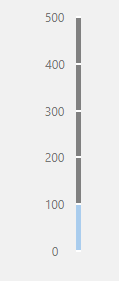
Linear Gauge at Runtime
Example of a horizontal orientation: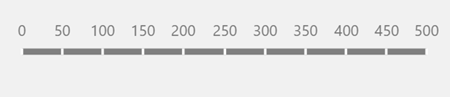
Example of a vertical orientation: