
Alarm Card
Use the alarm card to monitor your industrial assets. Get information from the HMI/SCADA system on alarms generated by their severity levels.
The alarm card widget is available under . When designing application pages, drag and drop GEAlarmCard to a container.
Alarm Card Properties
| Field Name | Description |
|---|---|
| View All Alarms by default (Disabling this option will display context based alarms) | This is a default setting to show all alarms irrespective of context when
the page loads at runtime. If using the bread crumb widget along with the alarm card, then alarms are displayed according to the context. If an alarm contains an OPC UA tag that is not associated with a model property, then the source server of the tag is displayed in the alarm grid. |
| Asset Name (Optional Override) | Select your own asset to display alarms. The selected asset overrides the default asset name at runtime. |
| Data Source (default data source used to filter alarms on page load) | Select a data source to set as default for filtering alarms on page load at runtime. |
| Page Size - Number of alarms to display per page | Enter a number to specify the number of alarms that appear on a page at runtime. The maximum number of alarms you can display per page is 100. |
| Auto Hide Columns | Select to automatically hide the table columns if screen space is a
constraint. Note: This option is enabled by default. To hide any of the other
columns at runtime, you must clear the check box for this
option. |
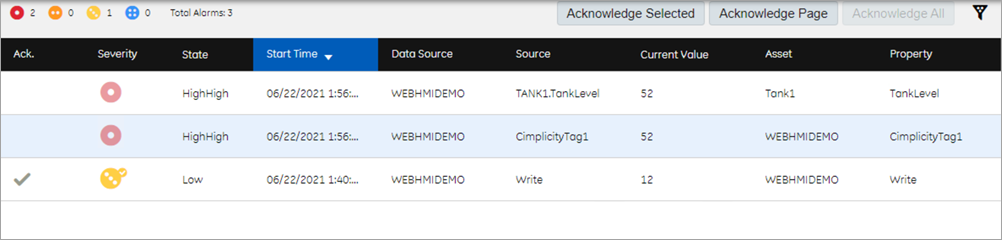
| Hide Acknowledge Column | Select to hide the Ack. column at runtime. This column contains the status to indicate whether the alarm is acknowledged in the HMI/SCADA system or not. A check mark in this column indicates that the alarm is acknowledged. |
| Hide Severity Column | Select to hide the Severity column at runtime. This column contains the icon that indicates the alarm severity status. |
| Hide Start Time Column | Select to hide the Start Time column at runtime. This column contains the start time and date for the alarm. |
| Hide Source Column | Select to hide the Source column at runtime. This column contains the tag associated to the alarm. |
| Hide Current Value Column | Select to hide the Current Value column at runtime. This column contains the query value such as whether the alarm is running or stopped. |
| Hide Asset Column | Select to hide the Asset column at runtime. This column contains the asset name associated to the alarm. |
| Hide Property Column | Select to hide the Property column at runtime. |
| Hide Description Column | Select to hide the Description column at runtime. |
| Hide State Column | Select to hide the State column at runtime. This column contains the alarm's current status. |
| Hidden | Select this check box if you want to hide the
plug-in. To show the hidden plug-in in Operations Hub new layout, go
to Page Visuals and under
Action column, select |
Alarm Card at Runtime
To acknowledge alarms, you must have the permission to do so in the supporting HMI/SCADA system.
Select  to
filter alarms based on specific
conditions.
to
filter alarms based on specific
conditions.
Each icon has a corresponding number to indicate the number of alarms currently active for that severity level. The alarm count in the banner shows the number of alarms per severity level for all assets in the model, whereas the alarm card displays the number of alarms per severity level for the selected context.
application.properties
file to modify alarm severity ranges.You can modify the property
rank.ranks in C:\Program Files\GE\Operations
Hub\webhmi-tomcat\webapps\alarm-microservice\WEB-INF\classes\application.properties
and restart webHMI tomcat service.
| Icon | Description |
|---|---|
 |
Alarm is critical. |
 |
Alarm is high priority. |
 |
Alarm is medium priority. |
 |
Alarm is low priority. |
Alarm information is not displayed if data sources are disconnected. Select  to get more
information.
to get more
information.