
 Edge Software
Troubleshooting Devices
Use the Troubleshooting page to see CPU, memory, and disk usage for a device.
Procedure
- In the left navigation pane, select Device Manager.
- Click the link for the device to troubleshoot.
- Click the Troubleshooting tab. You see a graph representing CPU, memory, and disk usage information for the device. By default, the time window is set for the previous 24 hours from the present time.Note: Troubleshooting data is displayed only for the times the device is online. For example, if the device was online all day yesterday and is offline all day today, you see only the data for yesterday, when the device was online.
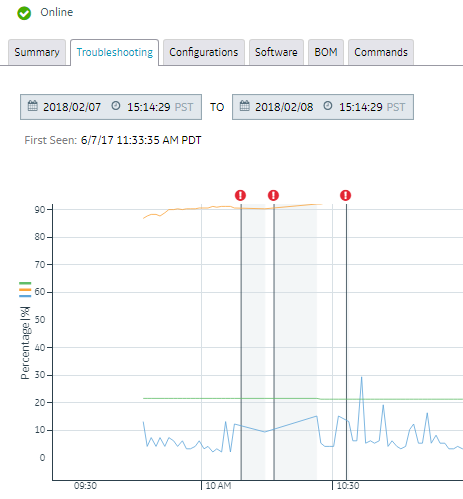 The red circles represent events, for example, the device was offline. The shaded area visually represents the duration of the event. Hover over the red circle for details about the event.
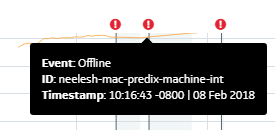 The First Seen date and time displays the first time the device connects to Edge Manager. Data does not display for dates and times that are earlier than the First Seen date and time stamp displayed for the device.
 - Click the calendar icon to change the time window to view.
- Click the pan icon (
 ) to move the graph.
 - Click the magnifying glass icon to zoom in on a data point.