CIMPLICITY
Option 9.1. Grid Tab in the Trend Control Properties Dialog Box
Select the Grid tab in the CIMPLICITY Trend Control Properties dialog box.
Grid options are as follows.
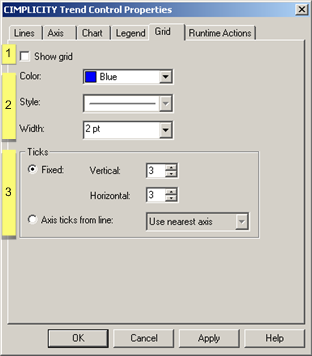
| 1 | Show grid |
| 2 | Color/style/width |
| 3 | Ticks |
| 1 | Show grid |
Show grid options are:
| Check | Display the grid on the chart. |
| Clear | Do not display the grid on the chart. |
Note: If you clear the check box, you have completed configuration of this tab.
| 2 | Color/Style/Width |
Grid lines' color, style and width options are
| Field | Description |
|---|---|
| Color | Click Color field's Palette button to configure the chart's colors: |
| Style | Select Solid or one of a variety of dot/dash lines in the drop-down list. |
| Width | (Available when a solid line is selected) Grid line width in points. |
| 3 | Ticks |
The Grid tab has two alternatives for specifying the number of grid lines to display.
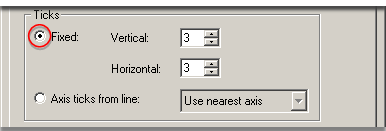
Fixed
A fixed number of horizontal and vertical grid lines to display
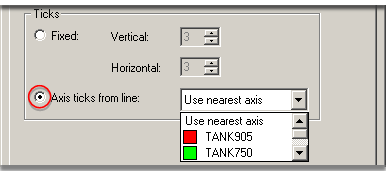
Axis ticks from line
Select an axis whose ticks will determine the grid lines.
Note: If you select Use nearest axis, the first axis with tick marks is used to determine the grid lines.