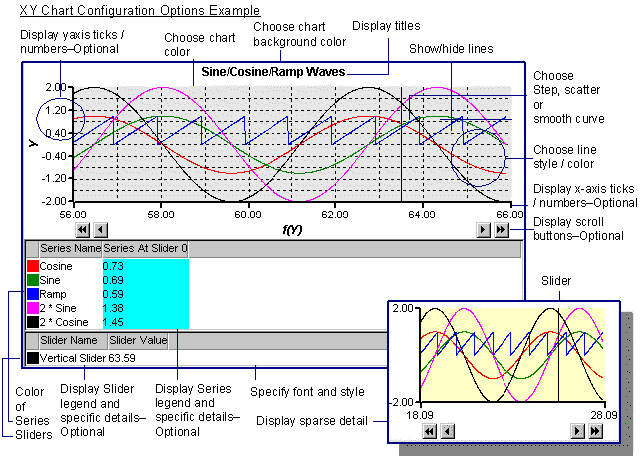
About XY Plots
XY Plots provide you with the ability to visually represent values in relation to each other. For example, you can plot real data vs. calculated date, or elements such pressure vs. temperature.
XY Plots provides you with:
| An extensive XY Plot object model with which you can script XY Plots that are as easy or as complex as you need. |
| A CIMPLICITY XY Control Properties dialog box to make detailed chart design selections. |
| A SmartObject XY Control with which you can quickly create an effective XY Plot. |
You have considerable control over what an XY Plot displays and its appearance using any of the tools that XY Plot provides.
- You can create an XY Plot that displays:
- One or several XY series
- One or more X,Y axes
- Minimum detail so a user can view quickly view the pattern of static values
- All the details a user needs to fully analyze any of the XY series
- Allow a runtime user, for the one runtime session, specify what should display.
- For display, you can choose the colors, line types and fonts that you think will work best.


