Gauge
Using a gauge widget, you can plot data on a visual display. Some of the gauge widgets use a color-coded scale. The color of the reading indicates the risk level associated with the value.
Types of Gauge Widgets
The following types of gauge widgets are available:
- Battery: In this gauge type, the value is plotted on a horizontal scale. This is the default gauge type. For example, the following image can represent a gauge that plots the speed of a vehicle in kph. The color-coded scale highlights whether the speed of the vehicle is safe or risky.

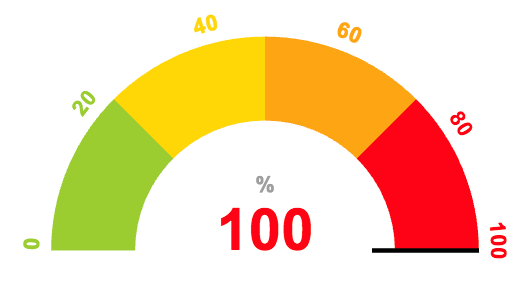
- Meter - Arc: In this gauge type, the value is plotted on a curved scale. For example, the following image can represent the percentage of unplanned power outage events out of the total number of power outage events. The color in which the plotted value appears indicates whether the percentage is acceptable.
- Meter - Radial: In this gauge type, the value is plotted on a circular scale. The gauge can be an internal radial or an external radial depending on whether the scale appears inside the radial or outside. For example, the following image represents an external radial meter gauge that plots the temperature inside an engine combustion chamber.
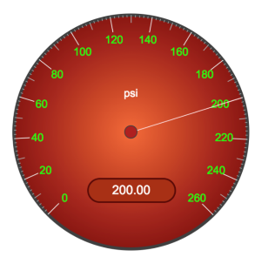
The following image represents an internal radial meter gauge that plots the pressure inside an engine combustion chamber.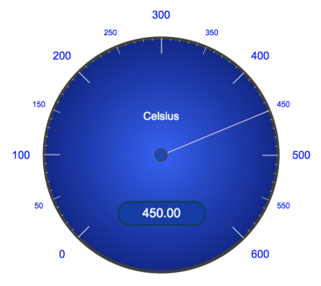
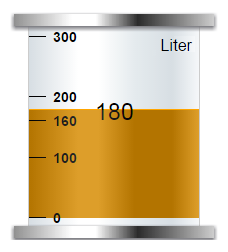
- Tank: In this gauge type, the value is plotted on a vertical scale. For example, the following image can represent the amount of remaining lubricant in a tank with a capacity 300 liters. The color in which the plotted value appears indicates whether the lubricant level is safe or risky.
Gauge Settings
When you use a gauge widget, in addition to providing values for the default fields for a widget, you must define the following settings:
| Type of the Setting | Applicable Gauge Types | Description | |||||||||||||||||||||||||||||||||||
|---|---|---|---|---|---|---|---|---|---|---|---|---|---|---|---|---|---|---|---|---|---|---|---|---|---|---|---|---|---|---|---|---|---|---|---|---|---|
| Type | All gauges | Identifies the type of the gauge. You can select Battery, Meter, or Tank. | |||||||||||||||||||||||||||||||||||
| Style | Meter | Identifies the meter style. You can select one of the following values:
| |||||||||||||||||||||||||||||||||||
| Source | All gauges | Identifies the source of the values plotted on the gauge. You can specify one of the following types of sources:
| |||||||||||||||||||||||||||||||||||
| Sector | Battery, Tank, Meter - Arc | Identifies the start position, color, and range for each sector in the gauge. For example, suppose you want to plot the speed of a vehicle. You want to categorize the speed range as follows:
In this case, you will create four sectors and define the following settings:
Tip: In the Color box, you can enter a color name or the hexadecimal code of the color.
| |||||||||||||||||||||||||||||||||||
| Range | All gauges | Identifies the minimum and maximum values of the widget range, and units of measure of the gauge. You can also specify the color for the first sector of the gauge. In the previous example, you will enter the values 0, 200, kph, and green in the Minimum, Maximum, Units, and Default Color boxes, respectively. | |||||||||||||||||||||||||||||||||||
| Scale | Meter - Arc | Indicates whether you want to show the marking for each sector or just the minimum and maximum markings of the gauge. In the Scale settings, select one of the following options:
| |||||||||||||||||||||||||||||||||||
| Needle | Meter - Arc | Indicates whether you want to show or hide the needle for the reading. By default, this check box is selected. | |||||||||||||||||||||||||||||||||||
| Visual | All gauges | Identifies the color for the markings and the background of the widget. The following settings are available:
|