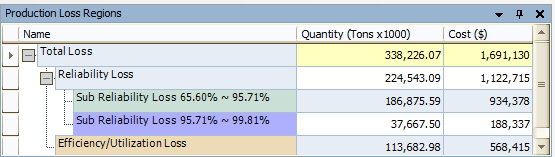
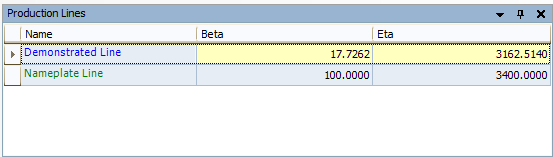
The Production Analysis page displays the Production Analysis Plot as datapoints on a graph. The dates for which the datapoints represent are displayed as a subtitle above the graph. There are two windows that appear below the analysis by default and display the values from defining the Process Reliability line, the Demonstrated Line, the Nameplate Line, and the Production Line:
The Production Analysis page contains the following task menus: Analysis Tasks, Analysis Settings, Common Tasks, and Associated Pages. These task menus give you quick access to common tasks associated with Production Analyses.
The Production Analysis page provides a
Copyright © 2017 General Electric Company. All rights reserved.