After you have drawn the Demonstrated Line, the Process Reliability Line, and the Nameplate Line, you can optionally draw one or more additional Custom Lines to compare historical or projected production rates to the observed production rate. For example, you might draw a Custom Line:
To compare the current year’s production to the previous year’s production.
To compare your company’s production rates with the production rates of another company that is using the same process.
To project how much more you could produce the next year if you improved your process to achieve a projected production rate.
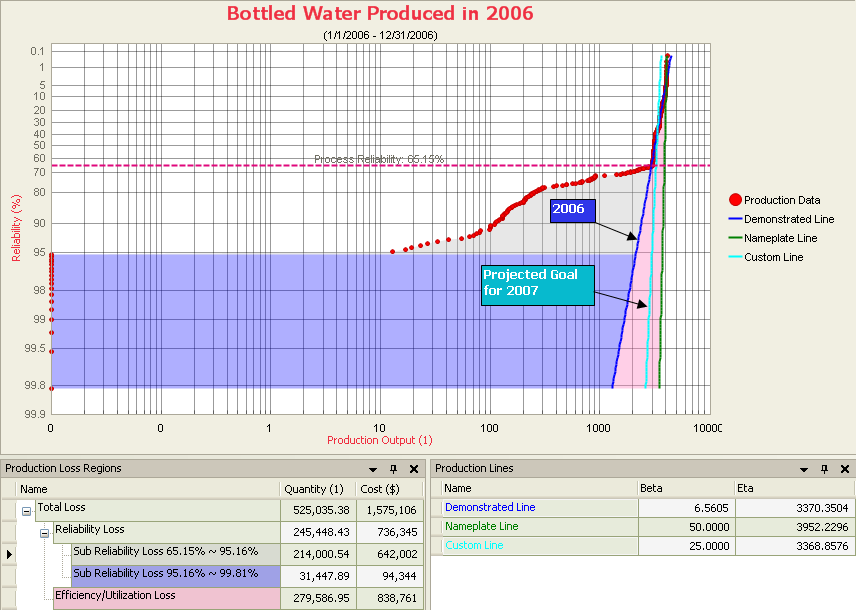
Again, consider our example of the bottled water production process. To increase our profits, we want to have a higher rate of production in 2007 than we did in 2006. To set a stretch goal for 2007, we have drawn a Custom Line using the Beta and Eta values that we want to achieve for 2007.
To draw the line, we used the Specify Beta and Eta option and chose the Eta value of 3368.8576, which is the same as the Demonstrated Line for 2006, and a Beta value of 25 to project less production variation than shown by the Demonstrated Line. After we have evaluated the differences in the current 2006 production rate and the anticipated 2007 production rate, we can begin determining what actions we need to take to achieve that goal for the following year.
Copyright © 2017 General Electric Company. All rights reserved.