The Production Loss Regions pane can optionally appear on the Production Analysis page.
The Production Loss Regions pane displays the calculations that summarize your Reliability Losses and your Efficiency and Utilization Losses. The Production Loss Regions pane contains various rows, depending on which lines have been created on the analysis.
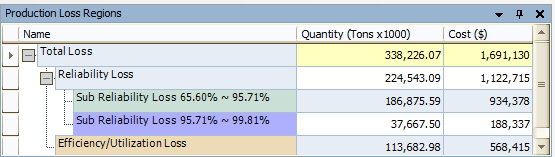
Total Loss: The sum of the Reliability Loss and the Efficiency/Utilization Loss.
Reliability Loss: The sum of the production loss is the region that lies between the Minimum Production Output value and the Demonstrated Line, below the Process Reliability Line. If breakpoints exist, then the Reliability Loss is also the sum of all the Sub Reliability Loss regions.
Sub Reliability Loss: For the first Sub Reliability Loss row, the sum of the losses between the Demonstrated Line and the first breakpoint, below the Process Reliability Line. For subsequent Sub Reliability Loss rows, the sum of the losses between the previous breakpoint and the next breakpoint, below the Process Reliability Line.
Note: Sub Reliability Loss rows will appear only if breakpoints exist on the Production Analysis. The number of Sub Reliability Loss rows will correspond to the number of breakpoints that have been inserted.
Because all Reliability Losses are calculated below the Process Reliability Line, the values for the Quantity and Cost will change if you change the location of the Process Reliability Line.
Efficiency/Utilization Loss: The sum of the production losses between the Demonstrated Line and the Nameplate Line.
For each row on the Production Loss Regions pane, the following columns are displayed:
Name: The name of the production loss region.
Quantity: A value representing the total production loss for each region. To specify the units used to calculate these losses, you can change the unit of measure.
Cost: A value representing the amount of profit that was lost due to the production loss in each region. This value is always rounded up to the nearest dollar. To specify the currency, you can change the margin currency.
Hint: To export the data from the Production Loss Regions pane, right-click the window and click Copy Production Loss Regions Data. After the values have been copied, they can be pasted into other applications, such as Microsoft Excel.
Copyright © 2017 General Electric Company. All rights reserved.