Somewhere on the Production Analysis you should be able to identify
a group of datapoints that represent your typical output. Consider again
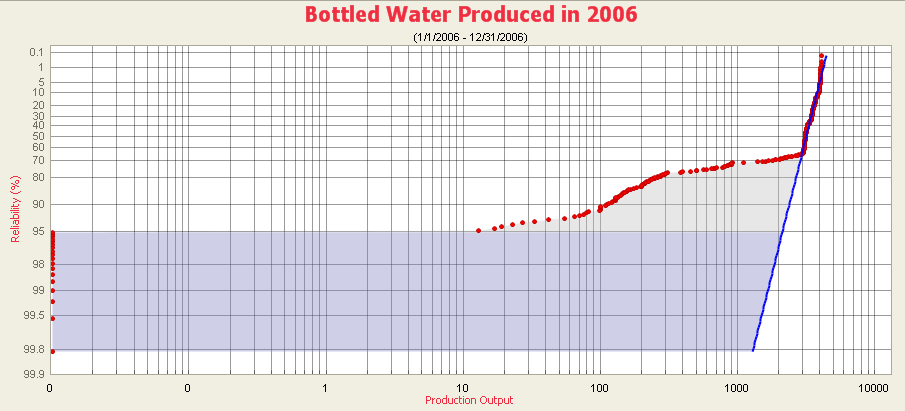
our example of the bottled
water production process. In the Production Analysis plot, notice
the group of datapoints between 3000 and 4000 bottles per day. Within
this range, the variation in number of bottles produced is relatively
small. This is the demonstrated
production output of our production process, where the production unit
produces the same amount on a regular basis. Therefore, we have defined
the Demonstrate Line along these datapoints.
The Demonstrated Line extends
beyond the plotted datapoint to show what the production would have been
if the production rate had not started to drop off due to reliability
problems, such as equipment and location failures, cutbacks, and downtime.
Hint: Drawing the
Demonstrated Line first can help
you determine where to draw the Process Reliability Line. You will want
to draw the Process Reliability Line where the datapoints begin to deviate
from the Demonstrated Line.
 The Demonstrated Line extends
beyond the plotted datapoint to show what the production would have been
if the production rate had not started to drop off due to reliability
problems, such as equipment and location failures, cutbacks, and downtime.
The Demonstrated Line extends
beyond the plotted datapoint to show what the production would have been
if the production rate had not started to drop off due to reliability
problems, such as equipment and location failures, cutbacks, and downtime.