Every process will have both ideal output value and actual output values. Ideally, a process should always produce the maximum possible output. The maximum possible output is determined by a variety of factors and is often influenced most significantly by manufacturer specifications. Many manufacturers specify a nameplate value for their equipment to indicate the highest capacity of a given piece of equipment under ideal operating conditions. Together, the nameplate values for the individual pieces of equipment can help you determine the nameplate value for the entire unit, which is the maximum production output for the process under ideal operating conditions.
After you have plotted your production data, you will want to draw a Nameplate Line on the Production Analysis Plot to indicate the ideal output. Meridium APM will calculate the difference between the ideal output and your observed output values (represented by the Demonstrated Line) to determine your Efficiency/Utilization Losses.
Note that it may not always be appropriate to use the manufacturers’ nameplate value as the nameplate value for your process. The maximum production capacity based upon manufacturers’ specifications may be unrealistic if you intentionally operate under conditions that do not meet those specifications. For example, you may operate at a lower temperature due to environmental constraints. If you calculate your production losses based upon an impossible goal, your losses may appear inflated. In this case, you may want to consider these factors into account to determine a more realistic nameplate value: one that actually can be achieved.
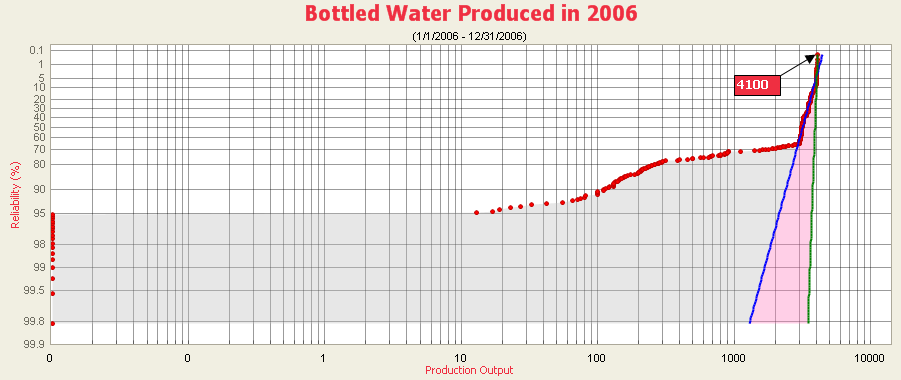
Consider again our example of the bottled water production process. On the Production Analysis Plot, notice that on October 18, 2006, the bottled water production process produced 4100 bottles of water, the highest observed value all year. In this example, we have drawn the Nameplate Line (green) through the highest actual production value, which we consider our ideal value. This will help us determine the efficiency and utilization losses by comparing the ideal production output to the observed production output.
Alternatively, your process may be operating precisely according to the manufacturers’ specifications. In this case, you may want to draw your Nameplate Line at a location determined by the manufacturers’ nameplate values. In this case, the location of the Nameplate Line may or may not correspond to any actual output values that have been plotted. Even though the manufacturers’ specifications are being followed, the process may still be operating well below its maximum capacity, in which case the Nameplate Line may be drawn above your first observed output value.
Copyright © 2017 General Electric Company. All rights reserved.