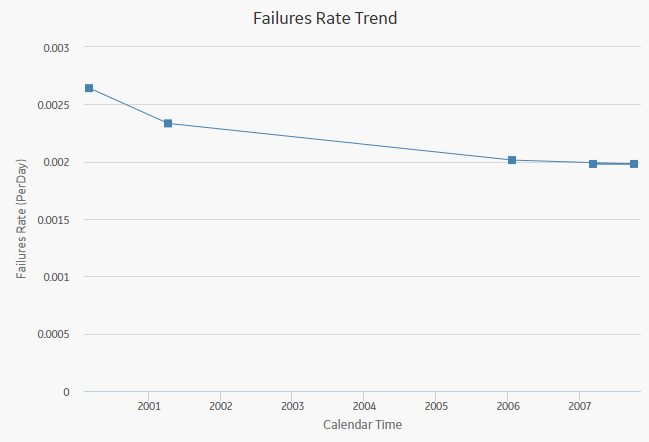
The <Measurement> Rate Trend graph displays the <Measurement> rate of a piece of equipment or location changes over time. This graph is the inverse of the Measurement Time between <Measurement> Trend graph. The datapoints represent observed <Measurement> dates included in the analysis. You can use the <Measurement> Rate Trend graph to view changes in the rate that <measurements> are occurring. You can also view the number of <measurements> occurring per day, rather than the number of days between <measurements>.
The following image displays a Failures Rate Trend graph:

Note: Interaction with graphs is not available on touch-screen devices.
While viewing the graph, you can:
Hover on any datapoint to view the coordinates and the details of a datapoint. You can view the number of cumulative <measurements> on the specified date, date of the observation, and <measurement> rate at the specified time.
Note: This feature may not be available on all devices. On tablets and smaller devices, you can tap on the datapoint to view the details of an observed datapoint.
Select an observed datapoint to display the Point Tooltip window and view the data.
On the Point Tooltip window, you can:
Select Split to Split the analysis into segments.
Note: If you have already split the data, Split will be replaced with Merge. You can select Merge to merge the segments again.
Copyright © 2018 General Electric Company. All rights reserved.