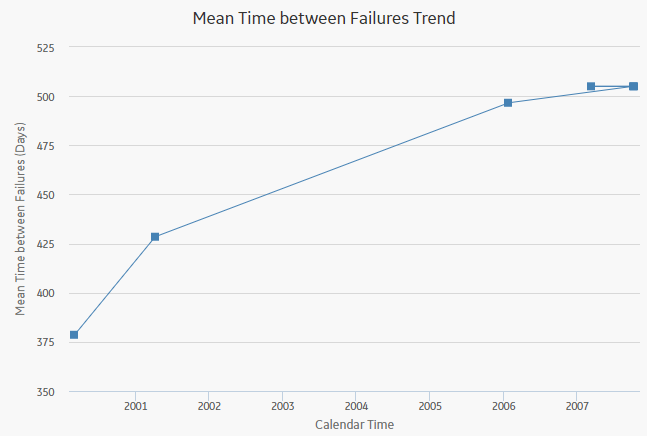
The Mean Time between <Measurement> Trend graph displays how the mean time between <Measurement> changes over time. The mean time between <Measurement> is calculated from the distribution of the <Measurement> over time. The datapoints represent observed failure dates included in the analysis. The Mean Time between <Measurement> Trend graph displays:
The following image displays a Mean Time Between Failures Trend graph:

Note: Interaction with graphs is not available on touch-screen devices.
While viewing the graph, you can:
Hover on any datapoint to access the coordinates and the details of a datapoint. You can access the number of cumulative <measurements> on the specified date, date of the observation, and mean time between <measurements> at the specified time.
Note: This feature may not be available on all the devices. On tablets and smaller devices, you can select on the datapoint to view the details of an observed datapoint.
Select an observed datapoint to display the Point Tooltip window and access the data.
On the Point Tooltip window, you can:
Select the Split to Split the analysis into segments.
Note: If you have already split the data, the Split will be replaced with Merge. You can select Merge to merge the segments again.
Copyright © 2018 General Electric Company. All rights reserved.