Select the Reliability Growth tab.
A list of Reliability Growth Analyses available in the database appears.
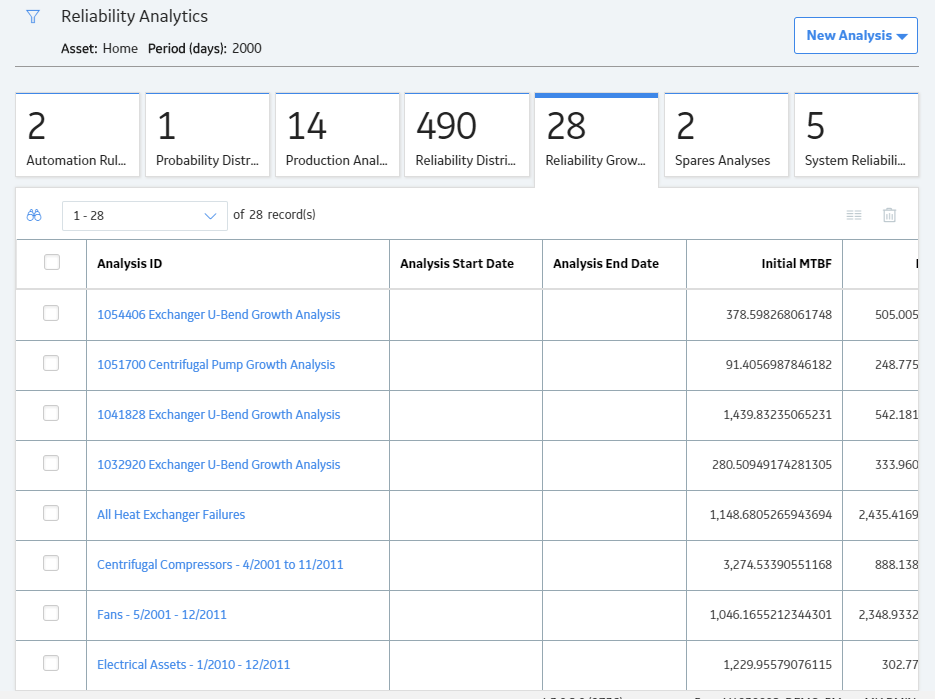
In the Analysis ID column, select the hyperlink for the analysis that you want to view.
The Reliability Growth page appears, displaying the Analysis Summary workspace.

The Analysis Summary workspace contains the Cumulative <Measurement> plot and the MTB<Measurement> plot. These plots are read-only plots. To edit a plot, you must select the corresponding tab from the left pane. The information displayed on this tab will look different depending on the type of data that you use for your analysis.
The bottom section of the workspace contains the Information and Segments tabs.
The Information tab displays the following information:
- Analysis Period: Contains the start and end dates of the analysis. If the analysis is based on cumulative operating time, it will be the start and end times of the analysis (e.g., 11,000 miles - 303,000 miles).
- : Contains the total amount of cumulative time that the Assets are in operation during the specified analysis period. For example, if you run one piece of equipment for 10 days, the total operating time is 10 days. If multiple Assets are included in the analysis, their operating time will be added together. Therefore, two Assets running for 10 days would have a total operating time of 20 days.
- Number of Assets: Contains the number of Assets included in the analysis.
- Total <Measurement>: Contains the total number of measurements (e.g., failures, cost) for all Assets in the analysis. The caption of this item will change depending on the measurement name.
- Initial Mean Time Between <Measurement>: Contains the Mean Time Between <Measurement> at the beginning of the analysis. This item is displayed only for analyses using event-based data.
- Final Mean Time Between <Measurement>: Contains the Mean Time Between <Measurement> at the end of the analysis. This item is displayed only for analyses using event-based data.
- Last Event Date: Contains the last <Measurement> date in the analysis. This item appears only for an analysis using event-based data.
- Next Estimated Event Date: The next estimated <Measurement> date, calculated by the GE Digital APM system. This item only appears for an analysis using event-based data.
The Segments tab displays the following columns:
- Segment: Contains a hyperlink, which you can select to view the details of the AMSAA model.
- Start Date: Contains the start date for the segment. For the first segment, this is the same as the analysis start date. For subsequent segments, this is the end date of the previous segment.
-
End Date: Contains the end date for the segment. For the last segment, this date is the same as the analysis end date. For multi-segment analyses, the end date of one segment is always the start date of the next segment.
Note: For a Reliability Growth Analysis based on cumulative operating time, the Start Date and End Date columns will be Start Time <units> and End Time <units>.
-
Termination Type: Contains a value that indicates whether the end date is event-based, time-based or grouped data. If you select the Time-Based option on the Set Analysis Period window, the value in the Termination Type column will be Time-Based. Likewise, if you select the Event-Based option on the Set Analysis Period window, the value in the Termination Type column will be Event-Based. If the analysis contains grouped data, the value in the Termination Type column will be Grouped-Data.
Note: If the Cumulative <Measurement> plot contains more than one segment, the Termination Type may vary between segments. If the analysis is Event-Based, all segments will be event-based. If the analysis is Time-Based, however, the last segment will be Time-Based, but the Termination Type for all other segments will be Event-Based.
- Beta: Contains a value representing the slope of the line in the Cumulative <Measurement> Plot. The Beta value helps serve as an indicator of whether the Mean Time Between <Measurement> is increasing, decreasing, or staying the same.
- Lambda: Contains a scale parameter that equals the Y-intercept of the Cumulative <Measurement> Plot at time t= 1. This value is used to calculate the time to next measurement (e.g., failure, cost).
- GOF Statistic: Contains a value calculated by a Cramer-von Mises or Chi-squared test that indicates the preciseness of the fit.
- Critical Value: Contains a standard value used to determine whether the analysis passes the goodness of fit (GOF) test.
- Passed GOF:
Contains a value that indicates whether
the segment passes the GOF test.
- The analysis passes the GOF test (i.e., the Passed GOF check box is selected) when the GOF Statistic is lower than the Critical Value.
- The analysis fails the GOF test (i.e., the Passed GOF check box is cleared) when the GOF Statistic is higher than the Critical Value.
The left pane in the workspace contains the following tabs:
- Cumulative <Measurement> Plot: Contains the Cumulative <Measurement> plot for the selected analysis.
- Mean Time Between <Measurement> Plot: Contains the Mean Time Between <Measurement> plot for the selected analysis.
- <Measurement> Rate Plot: Contains the <Measurement> Rate plot for the selected analysis.