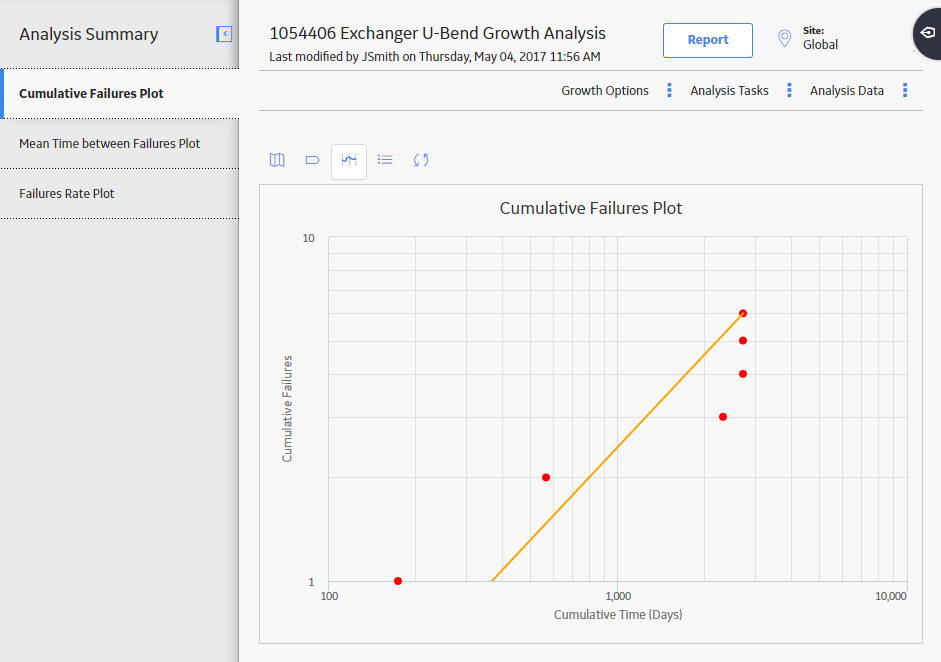
In the left pane, select the Cumulative <Measurement> Plot tab.
The Cumulative <Measurement> Plot appears in the workspace.

Note: You can also split an analysis into segments via the Mean Time Between <Measurement> Plot, and <Measurement> Rate Plot tabs.
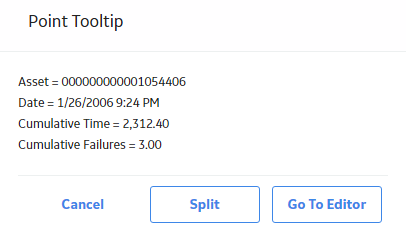
In the upper-right corner of the workspace, on the Cumulative <Measurement> Plot, select the datapoint that represents the last measurement recorded before you made a significant change to your work process.
The Point Tooltip window appears.

Select Split.
Note: The Split option is enabled only if there are at least three datapoints to the left and to the right of the datapoint you selected.
The plot line bends at the datapoint you selected, representing two segments instead of one.
Although the analysis still has an overall Initial and Final MTBF, each individual segment now also has its own Initial and Final MTBF. The AMSAA Reliability Growth Model page for an analysis based on event or an analysis not based on an event will also display different information for each segment. Each segment is colored according to whether it passed the GOF test. If the segment is blue, it passed the GOF Test. If the segment is orange, it failed the GOF test.
Note: When you split the analysis manually via the Cumulative <Measurement> Plot tab, the MTBE Trend Plot and <Measurement> Rate Plot tabs will also reflect the split.