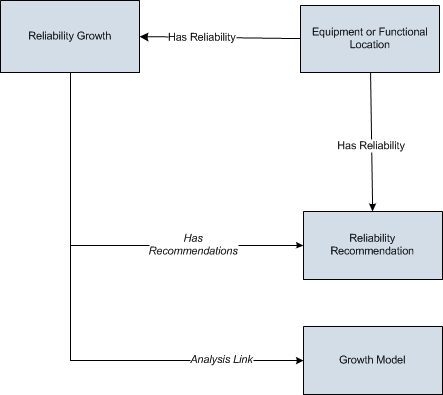
The following diagram shows how the families used in Reliability Growth Analysis are related to one another.
Note: In the diagram, boxes represent entity families and arrows represent relationship families that are configured in the baseline database. You can determine the direction of the each relationship definition from the direction of the arrow head: the box from which the arrow originates is the predecessor, and the box to which the arrow head points is the successor.
As you develop a Reliability Growth Analysis, you will create records in these families and link them together, either manually or automatically via the options in the GE Digital APM Framework. Throughout this documentation, we use the term Reliability Growth Analysis to mean the combination of the Reliability Growth record and all the records that are linked to it.
Copyright © 2018 General Electric Company. All rights reserved.