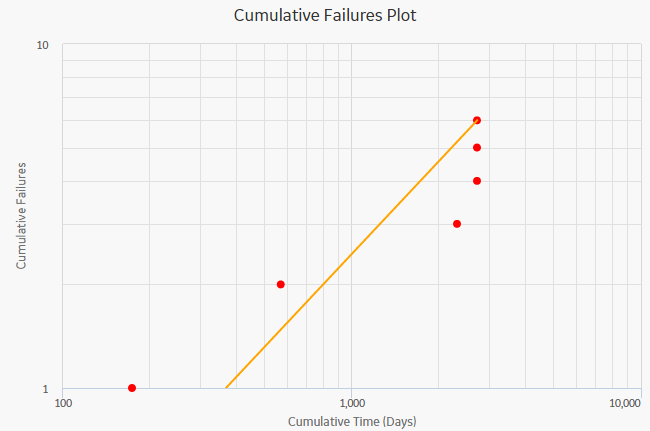
The Cumulative <Measurement> Plot is a log-log graph with data overlay. The graph uses logarithmic scales on both the horizontal and vertical axes. The graph represents the cumulative <Measurement> as a function of the cumulative time (Cumulative Failures vs. Cumulative Operating Time), which is the total amount of time the Asset has been in operation since the start of the analysis.
The following image displays the Cumulative Failures Plot:

Note: Interaction with graphs is not available on touch-screen devices.
While viewing the graph, you can:
Hover on any datapoint to view the coordinates and the details of a datapoint.
Note: This feature may not be available on all the devices based on the screen resolution. On tablets and smaller devices, you can select the datapoint to view the details of an observed datapoint.
For a datapoint on the estimated data line, you can access the name of the segment, cumulative time at the selected point on the line, number of cumulative <measurements> at the selected point on the line, value of beta and lambda, and determine whether the analysis passed the GOF test or not.
You can also determine whether the analysis passed the GOF test by the color of the plot line. If the graph line is blue, it passed the GOF test. If the plot line is orange, it failed the GOF test.
Select an observed datapoint to open Point Tooltip window and view the data.
On the Point Tooltip window, you can:
Select Split to Split the analysis into segments.
Note: If you have already split the data, Split will be replaced with Merge. You can select Merge to merge the segments again.
Copyright © 2018 General Electric Company. All rights reserved.