Reference Information: Query Types
About Select Queries
A Select query returns a list of records that belong to one or more specified families and match your query criteria.
The results of a Select query can provide you with a comprehensive or custom view of the data that exists in the families in your database, allowing you to see only the records and fields that you need to see. Creating a Select query is also often the first step in a process that involves using the query results to perform a certain task. For example, you might create a Select query and then use those results to build a report or create a graph.
About Crosstab Queries
A Crosstab query lets you group data into categories, where a category is determined by a value that exists in multiple fields across multiple families in the database.
In the results of a Select query, each field appears in a column, providing a simple list of data. The results of a Crosstab query appear in a grid. In other words, a Crosstab query presents the same information as a Select query, but in a different format. The format that you choose will depend on the type of information that is returned by the query, and how you want to view it.
Example: Select vs. Crosstab Query Results
Suppose you have a family called Pumps, which stores data on Pump Location, Pump Manufacturer, and Pump Failures. If you queried the family and included the location, manufacturer, and failures fields:
-
A Select query would display the results as shown in the following table.
Pump Location Pump Manufacturer Pump Failures Zone 1 ACME 3 Zone 1 SUPER 5 Zone 2 ACME 4 ...where each field appears as a separate column of information.
-
A Crosstab query would display the results as shown in the following table.
Zone ACME SUPER Zone 1 3 5 Zone 2 4 NULL ...where locations appear as rows, and manufacturers appear as columns.
In this example, you can see that ACME is the manufacturer of multiple pumps. The manufacturer, therefore, represents the category by which you want to display the remaining data (pump location). Each column in the results grid represents a separate value within the same category. So, in this example, ACME and SUPER are different types of manufacturers within the manufacturer category.
Example: Crosstab Query
When management personnel request that work be performed on a piece of equipment, the work results in some amount of downtime for the piece of equipment. Some work activities result in longer amounts of downtime than others. In your company, work requests are recorded in Work Request records, which contain the following fields:
- Work Request ID Identifies the work request with a unique value.
- Work Activity Indicates the type of work that should be performed (e.g., repair).
- Downtime Indicates the total amount of time that the equipment was out of service while work was being performed on it.
If you were to create a Select query to view information about work requests that have been completed, the results might look something like those shown in the following image.
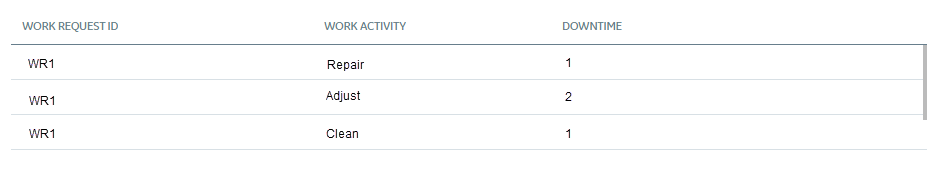
In these results, you can see each work request ID, the corresponding work activity, and the total amount of downtime per request. The format of these results, however, does not display the work requests grouped by activity type. While this result set is small, which allows you to visually determine how many work requests fall into each activity type, more typical query results will contain enough rows of data that it will be difficult to divide it into categories by visually comparing the data. This is especially true when the results span multiple pages.
To group the results such that you can see at a glance how many work requests fall into each activity type, you could decide to make the query an aggregate query. If you use the COUNT function on the Work Request ID field and the SUM function on the Downtime field, the query results would look similar to those shown in the following image.
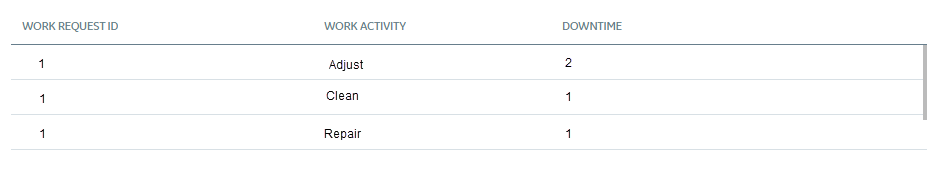
In these results, you can see that three work requests asked for an adjustment, three requests asked for something to be cleaned, and four work requests asked for a repair. You can also see that the total amount of downtime for all adjustments was four days, the total amount of downtime for all cleaning tasks was six days, and the total amount of downtime for all repairs was 20 hours.
While the stored data is interesting when viewed in this format, you might be more interested in determining which work requests resulted in a downtime over a certain number of days. For instance, suppose that you expect repairs to take over seven days, but cleaning tasks that take more than seven days are unacceptable to management personnel. You might want to construct the query such that it groups the raw data into two categories: downtime and work activity. You then want to determine how many work requests in each type of activity resulted in downtime between one and seven days, and how many resulted in downtime over seven days.
The results of a Select query cannot present the data in this format. To format the data such that it provides the desired information, you must create a Crosstab query, where you can:
- Convert the stored downtime values into categories: 1 to 7 Days and Over 7 Days.
- Determine the total amount of downtime per work activity.
- Divide the total amount of downtime per work activity into the predefined categories of 1 to 7 Days and Over 7 Days.
The Crosstab query will contain the same fields as the Select query: Work Request ID, Work Activity, and Downtime.
To convert the stored downtime values into categories, however, you will need to add another column that includes a DECODE statement that uses the SIGN function.
The DECODE statement would look like this:
Decode(SIGN(([Work Request].[Downtime] - 7)), -1, '1-7 Days', 0, '1-7 Days', 'Over 7 Days')
This statement indicates that:
- First, the value seven should be subtracted from the actual downtime values. Because the Downtime field has a unit of measure of Days, and there are seven days in a week, each downtime value will be greater than or equal to zero and less than or equal to seven. After subtracting the value seven from these stored downtime values, the calculated result will be either a negative number, zero, or a positive number.
- After subtracting seven from the actual downtime value:
- If the value is negative or zero, the record should be grouped into the category 1 to 7 Days. This means that any work request with the following downtime values will be grouped into the 1 to 7 Days category: 0, 1, 2, 3, 4, 5, 6.
- If the value is anything other than zero or a negative number, the record should be grouped into the category Over 7 Days. This means that any work request with a downtime value greater than or equal to eight will be grouped into the category Over 7 Days.
In the grid in the Conditions section, the Work Activity field will be the row heading, and the column with the DECODE statement will be the column heading. The Work Request ID field will be the intersecting field, or the Value, and a COUNT function will be defined in the Total cell for the Work Request ID field. This means that the intersecting cell in the results will contain a number instead of a Work Request ID. The number will indicate the number of work requests that fall into the category defined by the intersection of the row and the column (e.g., the number of repair work requests that resulted in a downtime of over seven days).
In addition, the SUM function will be defined in the Total cell for the Downtime field. This will ensure that the results contain only one row representing each work activity instead of multiple rows containing the same work activity. For example, if there are three repair requests, because the SUM function is defined on the Downtime field, the results will contain only one row representing the repair work type (displaying the total number of work requests of that type) instead of three rows representing the repair work type (displaying only one work request of that type for each row).
The results will be grouped as shown in the following table.
| Work Activity | Downtime Category (1 to 7 Days) | Downtime Category (Over 7 Days) |
|---|---|---|
| Work Activity (Repair) | # of Repairs with a Downtime of 1 to 7 Days | # of Repairs with a Downtime Over 7 Days |
| Work Activity (Clean) | # of Cleaning Tasks with a Downtime of 1 to 7 Days | # of Cleaning Tasks with a Downtime Over 7 Days |
| Work Activity (Adjust) | # of Adjustments with a Downtime of 1 to 7 Days | # of Adjustments with a Downtime Over 7 Days |
About Update Queries
An Update query modifies the records that match the criteria that you have specified in the query. An Update query makes global changes to a group of records belonging to one or more families.
An Update query is similar to a Select query in that it retrieves records from the database that match the criteria defined within the query. The difference is that instead of displaying the results, the results are modified according to the criteria defined in the query.
For example, if an equipment manufacturer name has changed, you would need to update all the existing records for equipment made by that manufacturer so that the value in the Manufacturer field is the new name of the manufacturer. Instead of manually modifying these values, you could create an Update query to modify all the records for this family.
Only Super Users and members of the MI Power User Role Security Group can create and run the Update queries, provided that they have been granted View permissions to the Catalog folder in which they are stored. To update the records returned by the query, a user must have Update permissions to the family to which those records belong.
About Append Queries
An Append query adds a group of records from one or more families to another family.
An Append query lets you:
- Use a predefined Select query to find records in one or more families that you want to add to another family.
- Take the records that are returned and add them to other families, thereby creating new records in those families.
For example, you might create a set of records in one family that are the same or similar to a set of records that you also need to create in another family. You can also consolidate records that currently exist in multiple families into a single family. In either of these cases, you can use an Append query to find the records that currently exist in one family and add them to another family. In cases where you are using an Append query to move records, you might also want to use a Delete query to delete the records from the original family after they have been moved.
In an Append query, you will define field mappings to map fields in the source family to fields in the target family. Only fields that are included in the Select query can be mapped to the target family, so you will want to make sure that the query includes all the columns containing values that you want to use to populate new records. Any fields that are not mapped will not be populated in the new records. The process of defining mappings is facilitated by the Append To cell, which appears in the grid in the Conditions section when you create an Append query, and which allows you to select the target field to which each source field corresponds.
Only Super Users and members of the MI Power User Role Security Group can create and run the Append queries, provided that they have been granted View permissions to the Catalog folder in which they are stored. To create the records returned by the query, a user must have Insert permissions to the family in which the records are being created.
About Delete Queries
A Delete query deletes records that meet the criteria in the query from the database. Delete queries delete entire records, not just individual fields in records.
If you need to delete many records at once, this type of query can save you time. For example, suppose you created various records in a family and later determined that those records were invalid. You could create a Delete query to delete those records from the family based on the desired criteria, such as a value in the record, the creation date, or the user who created them.
Only Super Users and members of the MI Power User Role Security Group can create and run the Delete queries, provided that they have been granted View permissions to the Catalog folder in which they are stored. To delete the records returned by the query, a user must have Delete permissions on the family to which those records belong.