LCC Analyses
About LCC Analyses
LCC Analyses are economic analyses used to evaluate the total cost of ownership of an asset, including cost of installation, operation, maintenance, conversion, and decommission, through applying different operating scenarios to a model.
Managers are able to use analyses to understand the cost of ownership of Assets or fleets of Assets over defined accounting periods or planned asset life. By comparing scenarios, LCC Analyses provide information to inform choices to optimize costs over the period defined in the Analysis. Cost information is presented in a range of categories to help managers determine which assets to buy, what maintenance strategies are most cost effective, and when replacement is necessary. Informed decisions can be based on a range of financial criteria for all scenarios in the analysis, presented in a chart format. Examples include Capital Costs, Operating Costs and Cashflow.
For Example, as a transportation manager, I would like to evaluate the costs of owning a fleet of trucks. Using an LCC Analysis, the company will keep a log of the use and maintenance of each truck in the fleet in order to determine the exact cost of each truck in the fleet and to know when replacement or decommission should occur.
About Fleet Management
Using LCC Analyses, you can now manage a fleet of vehicles in one central location. Analyses are used to collect performance data, balance costs of ownership, and plan action items over the lifespan of each vehicle, and the fleet.
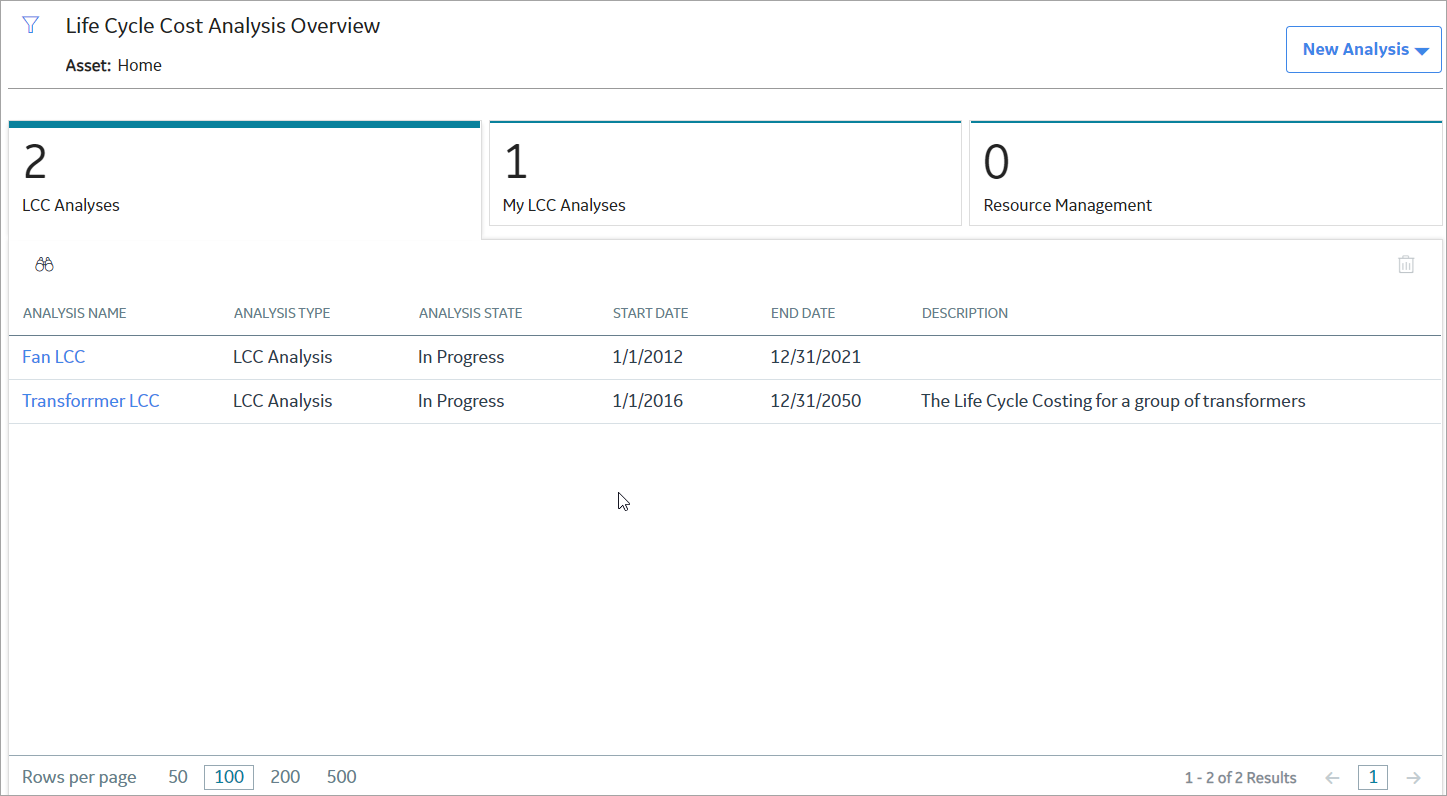
Access an LCC Analysis
Before You Begin
Procedure
- Select the LCC Analyses tab.
The LCC Analyses section appears, displaying a list of available LCC Analyses.
About Analysis Charts and Graphs
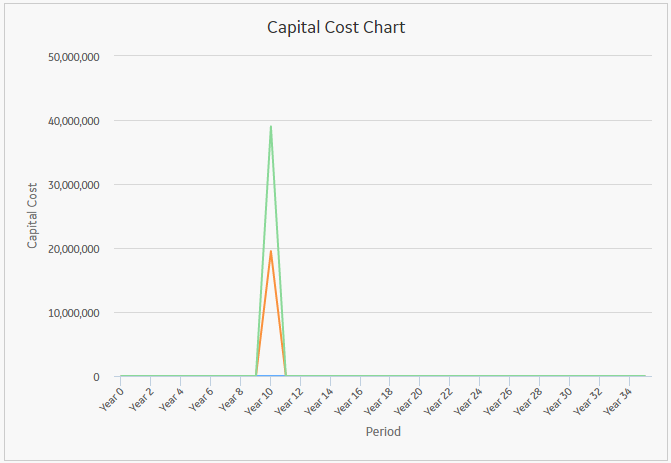
Capital Cost Chart
The Capital Cost Summary Chart displays the trend for each scenario, as well as the sum of all capital costs per period for each scenario.
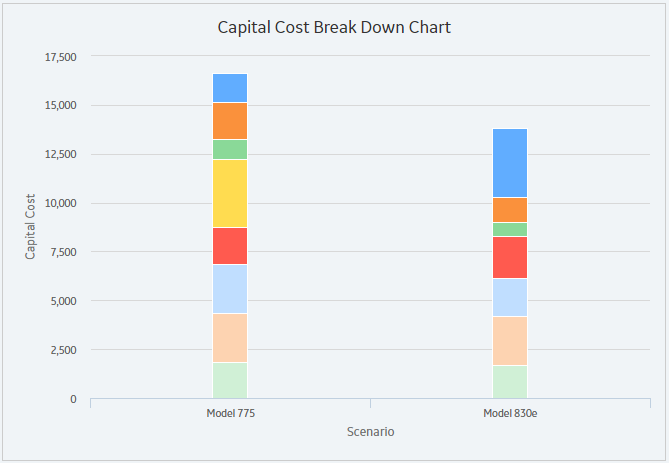
Capital Cost Break Down Chart
The Capital Cost Break Down Chart displays all the values that comprise the capital cost totals for each scenario in the analysis. Within the chart, you will see a complete breakdown of the costs contained in a scenario. If you hover over the individual capital costs, the title and details of the costs appear.
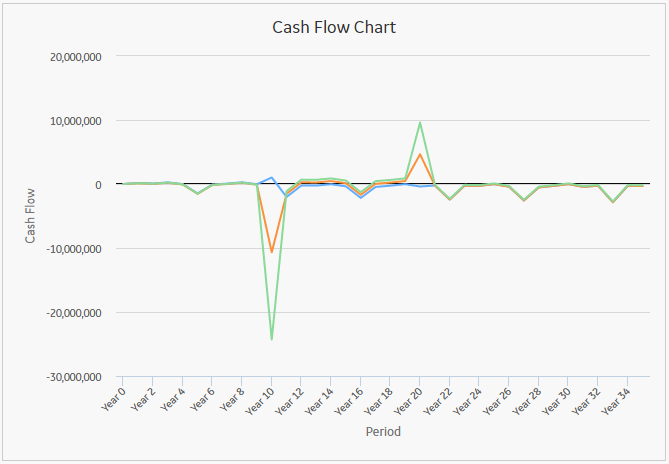
Cash Flow Chart
The Cash Flow Chart displays Cash Flow per period. All of the values from the Cost Data grid are factored into the output shown in the chart, making it easier for you to monitor the movement of money throughout the span of the Analysis and easily view and determine which scenario has the optimal cash flow as compared with other scenarios.
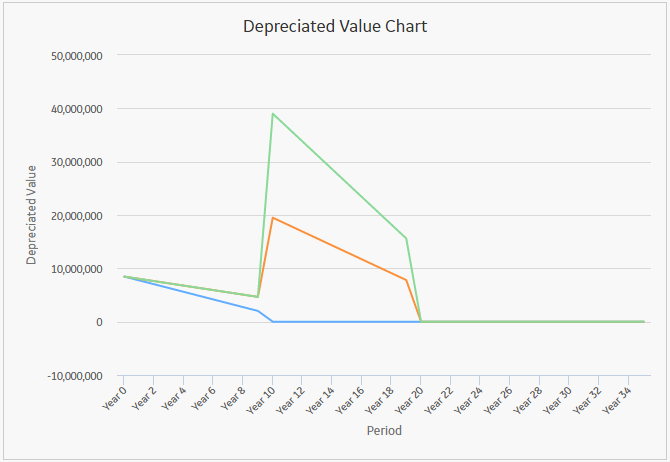
Depreciated Value Chart
The Depreciated Value Chart displays Depreciated Values per period for each scenario, detailing how the value of the asset has been depreciated throughout the analysis. The chart allows you to assess the overall depreciation so that a corrective course of action can be determined.
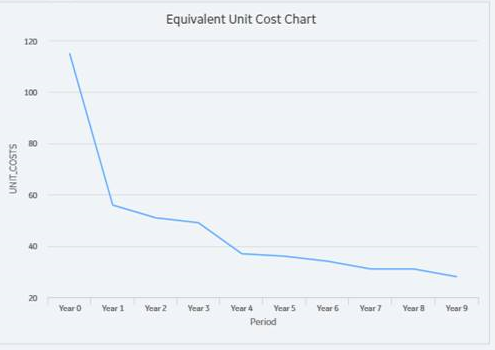
Equivalent Unit Cost Chart
The Equivalent Unit Cost Chart displays the average cost per operating unit as it has changed across the analysis lifespan.
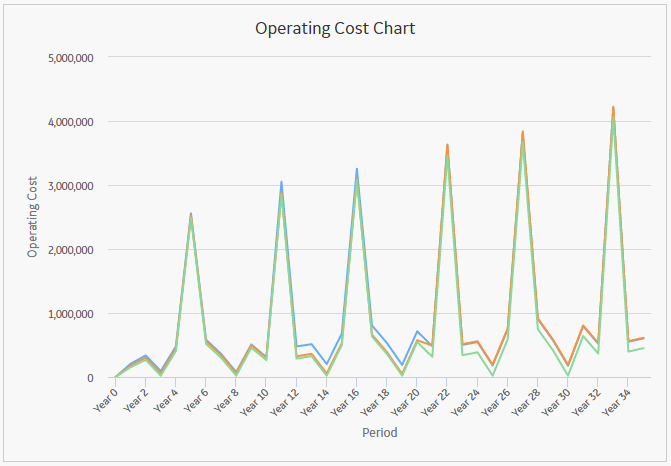
Operating Cost Chart
The Operating Cost Chart displays the trend, as well as the sum of all operating costs per period for each scenario. The chart allows you to review the overall operating costs of an Analysis and make decisions regarding future courses of action.
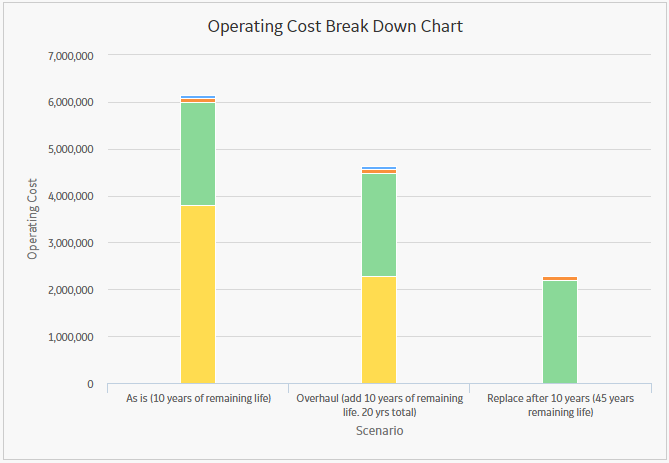
Operating Cost Break Down Chart
The Operating Cost Break Down Chart displays stacked bars for each scenario that are broken down by element; these break down the operating costs by elements. The Break Down chart enables you to see where money is being spent within each scenario, identifying major cost drivers and target areas for cost reduction. If you hover over the individual operating costs, the title and details of the costs appear.
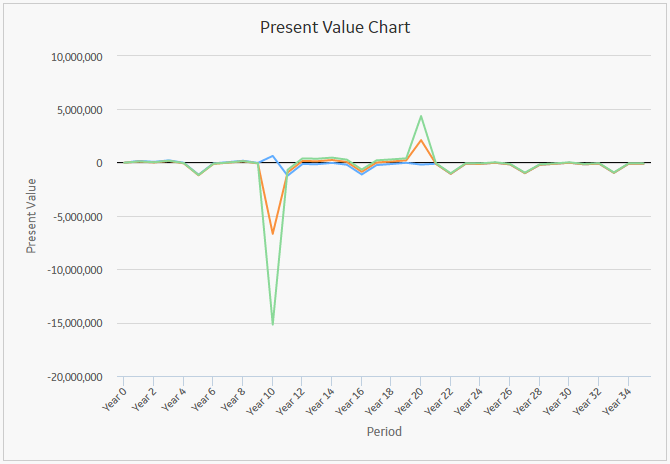
Present Value Chart
The Present Value Chart displays Present Values per period for each scenario. Present values are determined based on the Interest Rate.
The chart provides information to allow you to accurately view the expected worth of your Analysis based on the current Interest Rate.
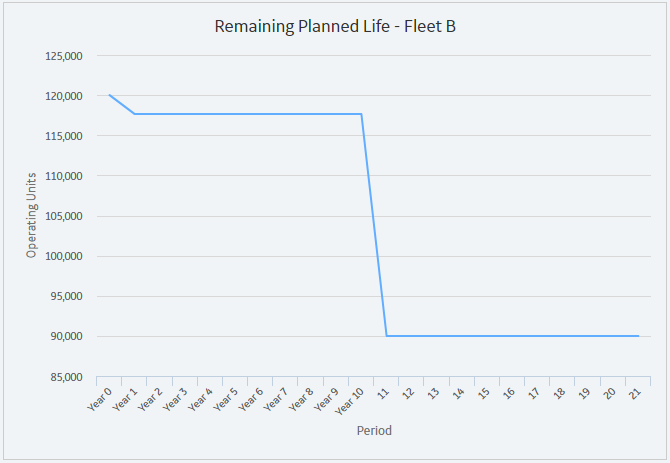
Remaining Planned Life
The Remaining Planned Life graph displays the amount of life that remains after consumption throughout a scenario, or all scenarios, in an analysis.
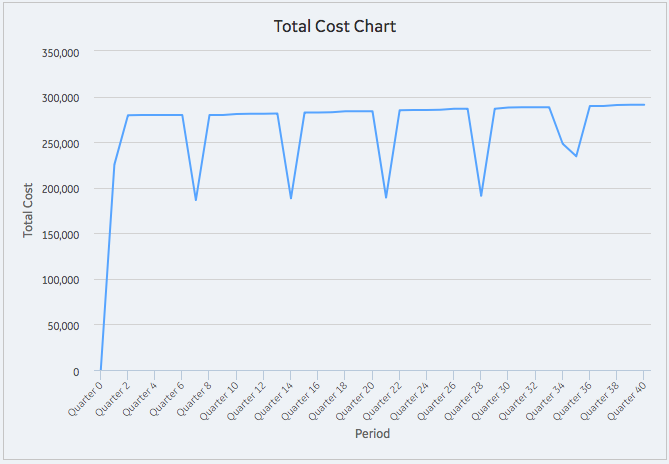
Total Cost Chart
The Total Cost Chart displays the cumulative summary trend of the associated capital costs and operating costs for each scenario. The chart allows you to review the overall capital costs and operating costs of an Analysis and make decisions regarding future courses of action.
Create an LCC Analysis
Procedure
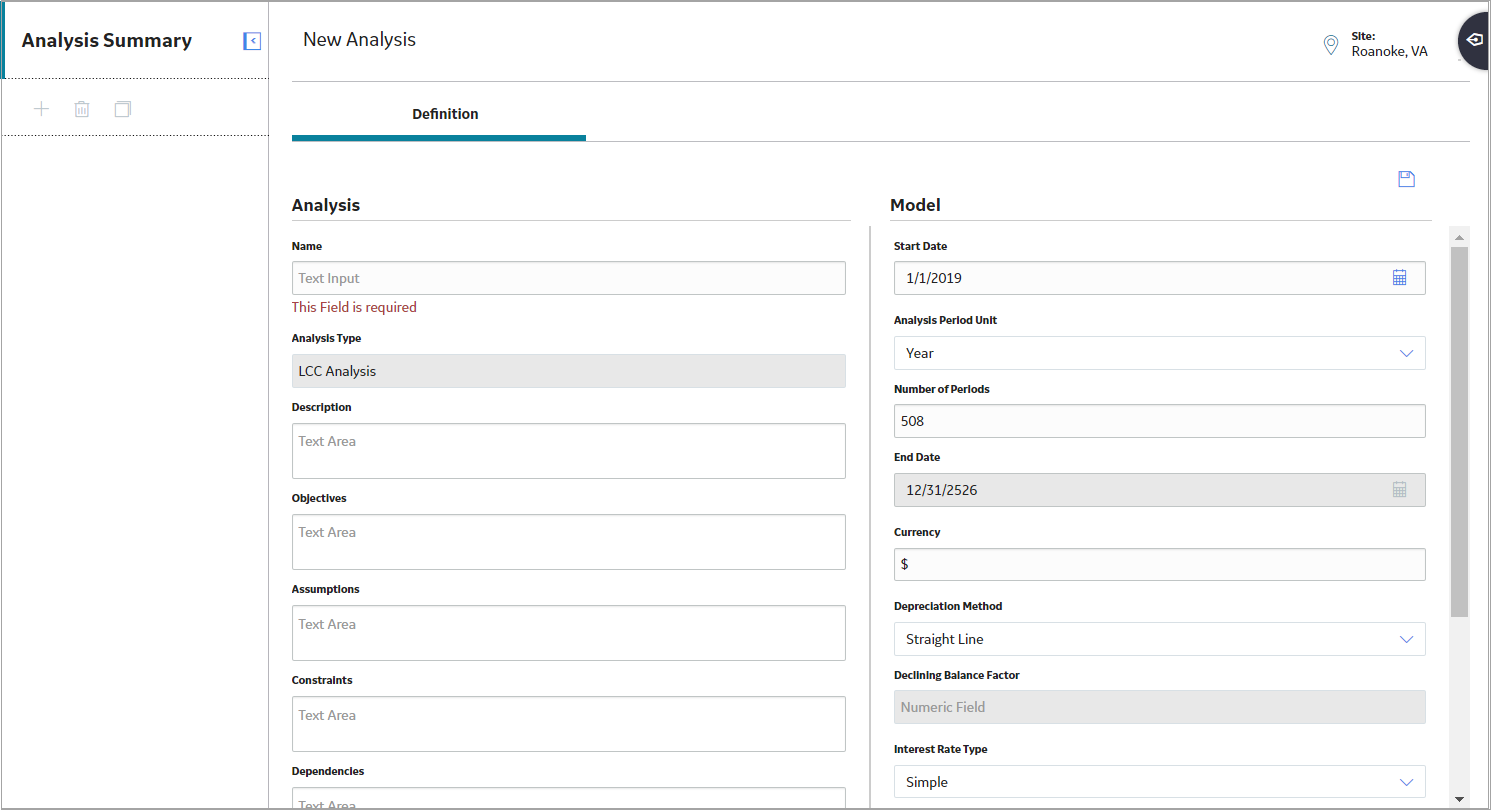
- In the upper-right corner of the page, select New Analysis, and then select one of the following options:
Option Description Basic Analysis Select this option if you want to create a standard life cycle cost analysis. Fleet Management Select this option if you want to create an analysis to manage a fleet. This option provides a profile for each secondary element, start and end lives, additional calculated values for EUC and Remaining Life, and additional charts. In a new page, the Analysis Summary workspace for the new analysis appears, displaying the Definition section.
- As needed, enter values in the available fields, and then select
 .
.The LCC Analysis is saved.
Modify an LCC Analysis
Procedure
- Select the Definition tab.The Definition section appears.
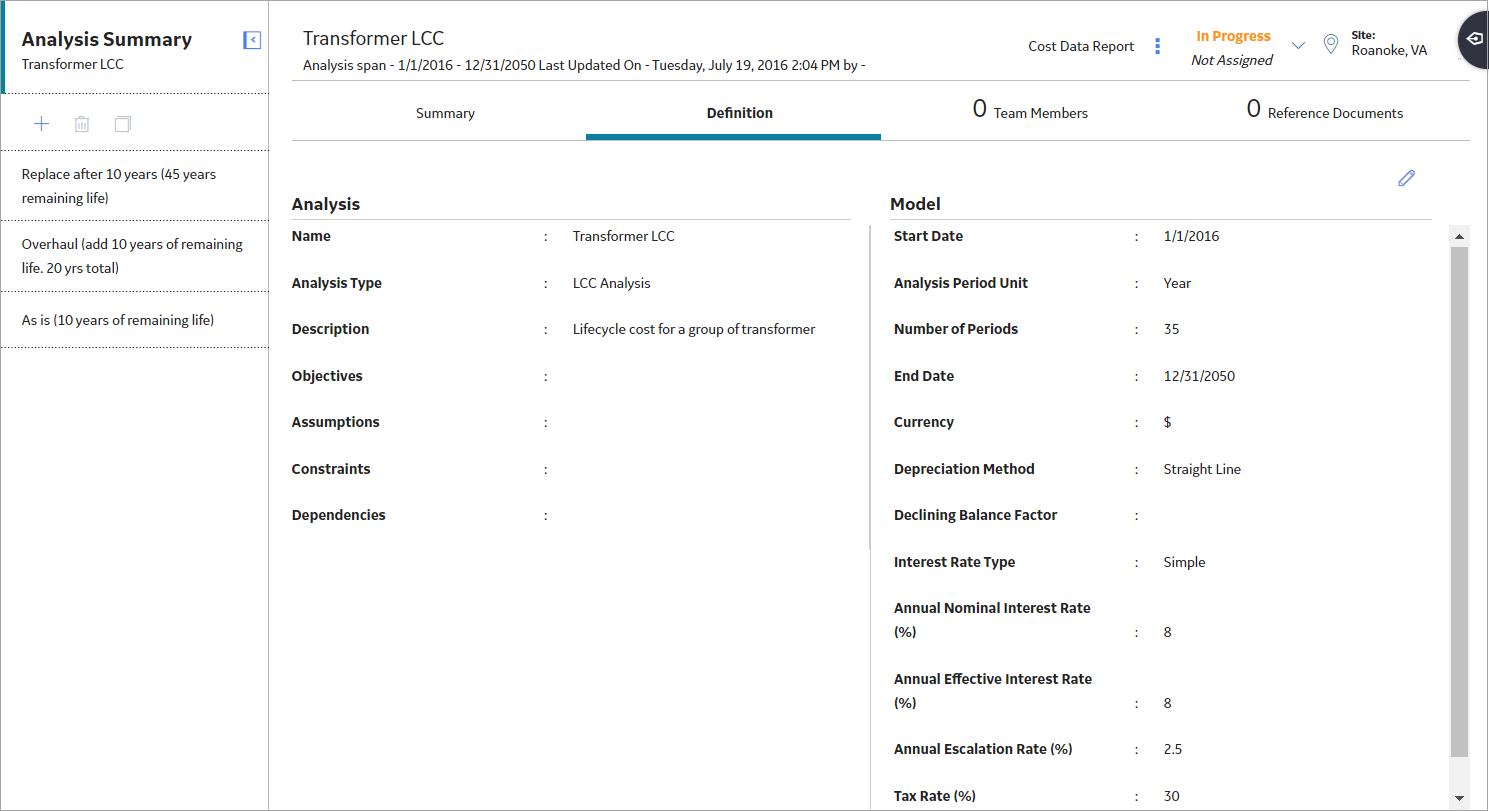
- Select
 .
. - Select .The analysis is saved.
Delete an LCC Analysis
Procedure
- At the top of the workspace, select
 .A confirmation message appears.
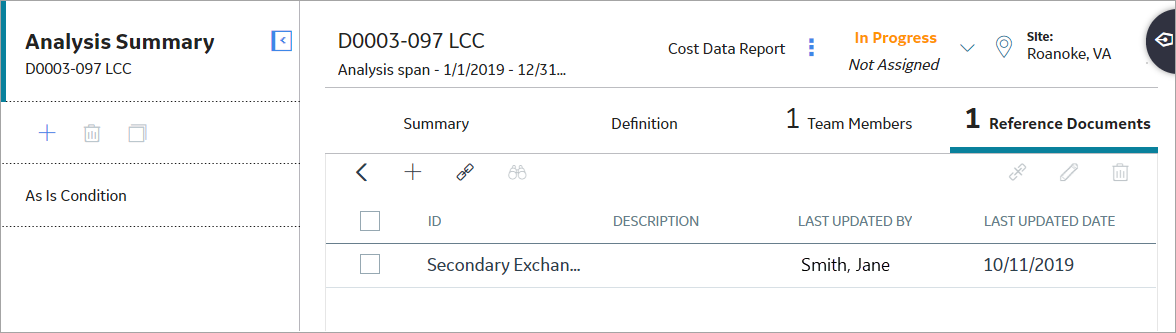
Access Reference Documents in LCC
Procedure
- In the workspace, select the Reference Documents tab.A list of Reference Documents linked to the selected LCC Analysis appears.
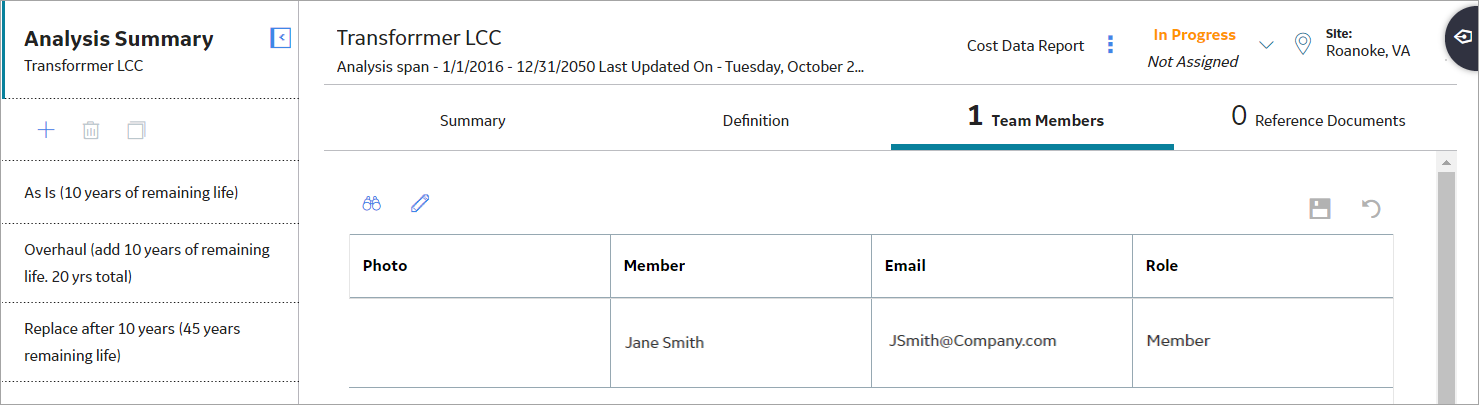
Access the LCC Team Members Section
Procedure
- In the workspace, select the Team Members tab.The Team Members section appears, displaying a list of team members assigned to the analysis.
 Tip: For details about working with teams and the Team Members section, refer to the Teams section of the documentation.
Access Recommendations in LCC
Procedure
- Select
 .The Recommended Actions pane expands.Tip: For information about additional options available when working with recommendation records, refer to the Recommended Actions section of the documentation.