Cost Data
About Cost Data
Example
For example, if the asset is a fleet of service vehicles, you would want to collect the following types of Cost Data:
- Maintenance Costs
- Replacement Parts
- Energy Costs
- Driver Costs
By collecting all of the above Cost Data, you can create an analysis to maintain, track, and predict costs throughout the lifespan of the fleet of service vehicles.
About Operating Costs
Blank Rows
Blank rows provide the option to add costs to the grid and apply them the applicable period(s).
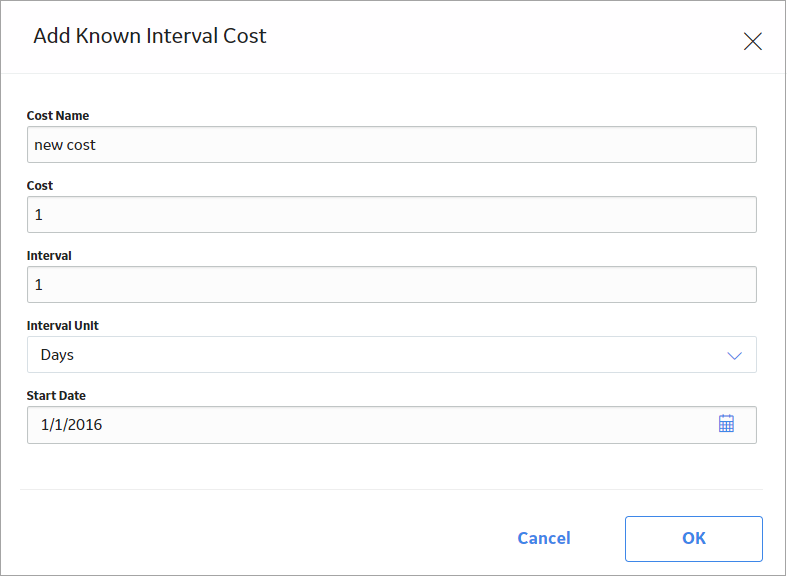
Known Interval/Cost
Known interval cost data provides the ability for you to track the ongoing costs that occur on a regular basis.
For example, a fleet of trucks have their air filters changed every 6 months. Air filter maintenance can be logged in the cost data grid by adding a Known Interval/cost and continued every 6 months for the life of the truck.
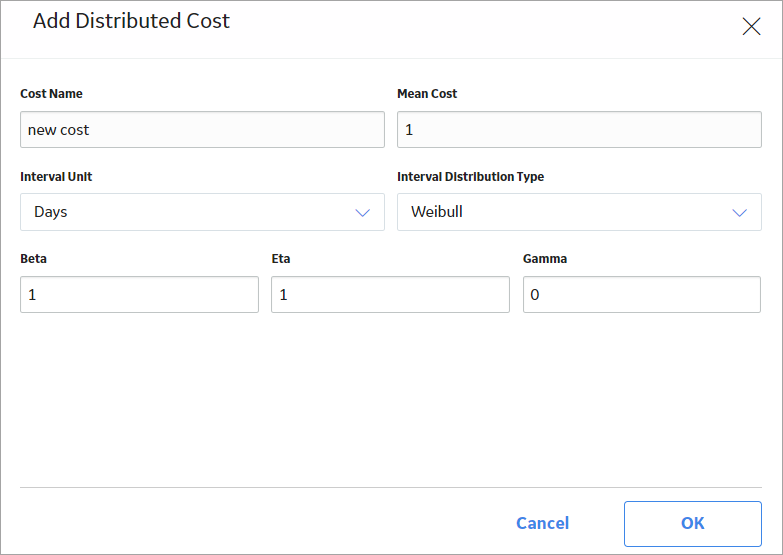
Distributed Costs
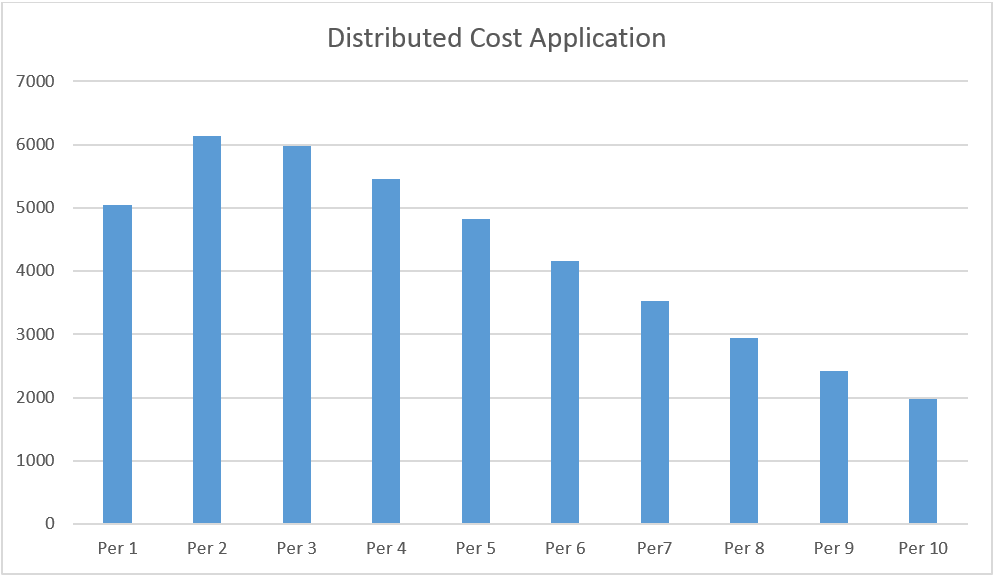
Distributed costs can be added where the user has the option to specify the distribution type and distribution parameters. The application of these costs will distribute the mean cost over all periods within the scenario based upon the shape of the distribution that was specified.
In a scenario with 10 yearly periods, where the user elects to apply a distributed cost with the following parameters:
- Mean Cost: 50000
- Distribution Type Weibull
- Beta: 1.25
- Eta: 72 (months)
- Gamma: 0
The costs would be applied as follows:
| Period | Cost |
|---|---|
| Period 1 | 5051 |
| Period 2 | 6137 |
| Period 3 | 5975 |
| Period 4 | 5463 |
| Period 5 | 4823 |
| Period 6 | 4158 |
| Period 7 | 3521 |
| Period 8 | 2940 |
| Period 9 | 2425 |
| Period 10 | 1981 |
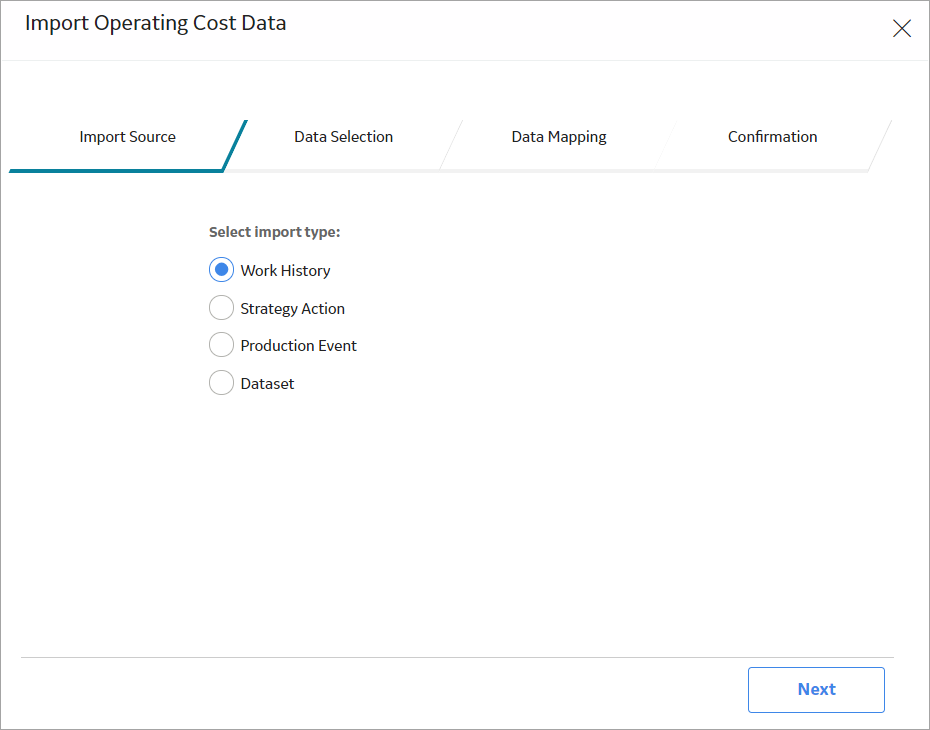
About Import Cost Data
In LCC, you are able to import cost data from sources including Work Histories, Strategy Actions, Production Events, and Datasets. Importing cost data in various forms allows you to evaluate the Total Cost of Ownership for an asset with all of the information in the Cost Data grid.
Possible Cost Data you may want to import:
- Equipment Failures.
- Shutdowns and Slowdowns + Maintenance actions.
- Insurance costs.
- Fuel/Energy usage.
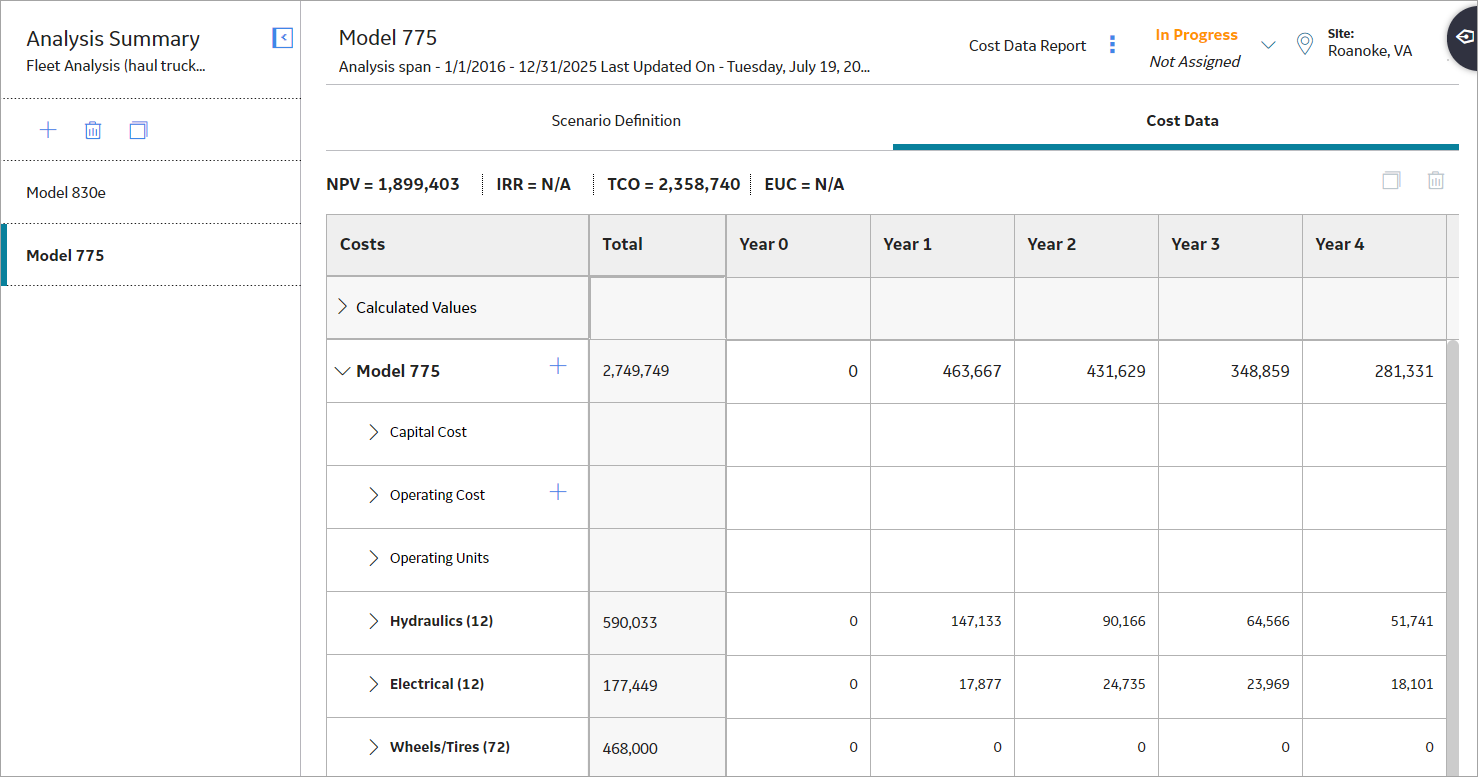
About Calculated Values
Calculated Values are located at the top of the Cost Data grid and are automatically factored or calculated from data from the Primary Element and Secondary Elements. Calculated values provide a mathmatical summation of the costs associated with each of the elements within the analysis.
Calculated Values Include:
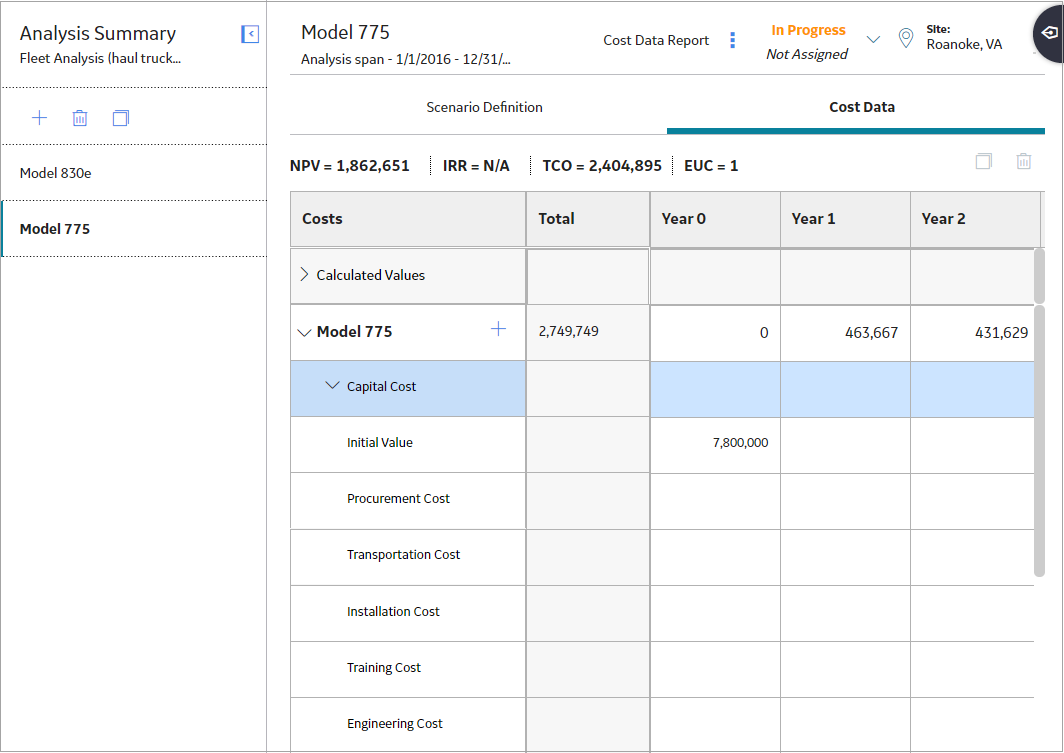
Access a Cost Data Grid
Before You Begin
Procedure
- Select Cost Data.The Cost Data section appears, displaying the Cost Data grid.Note: The unit displayed in grid heading (i.e., quarters, months, or years) is based on the Analysis Period Unit that you selected when you created the analysis.
Create a Resource
Procedure
- In the cell for the Cost Element to which you want to add a resource, select
 , and then select Add a New Resource.
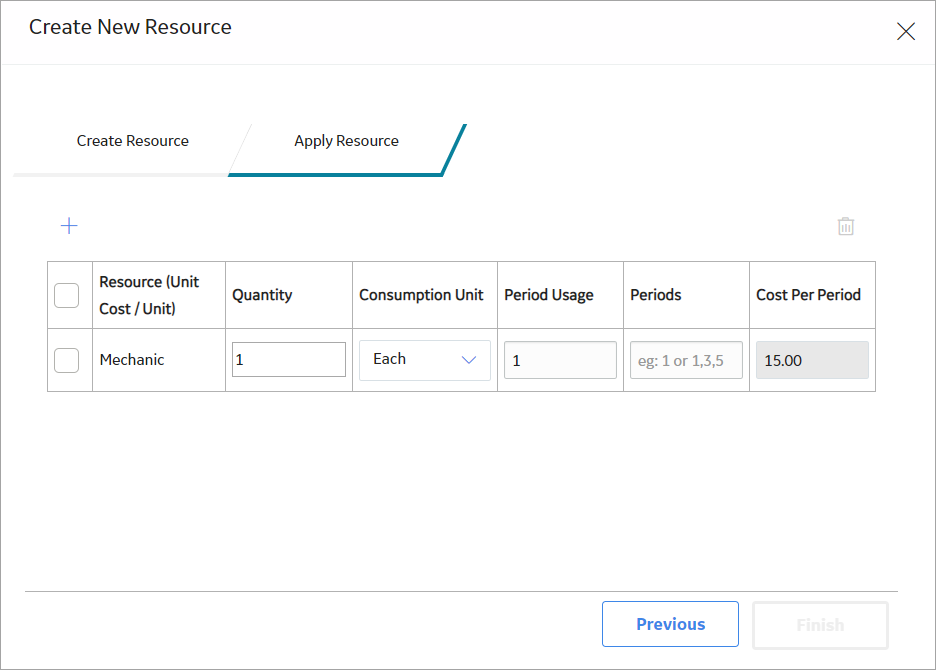
The Create a New Resource window appears.
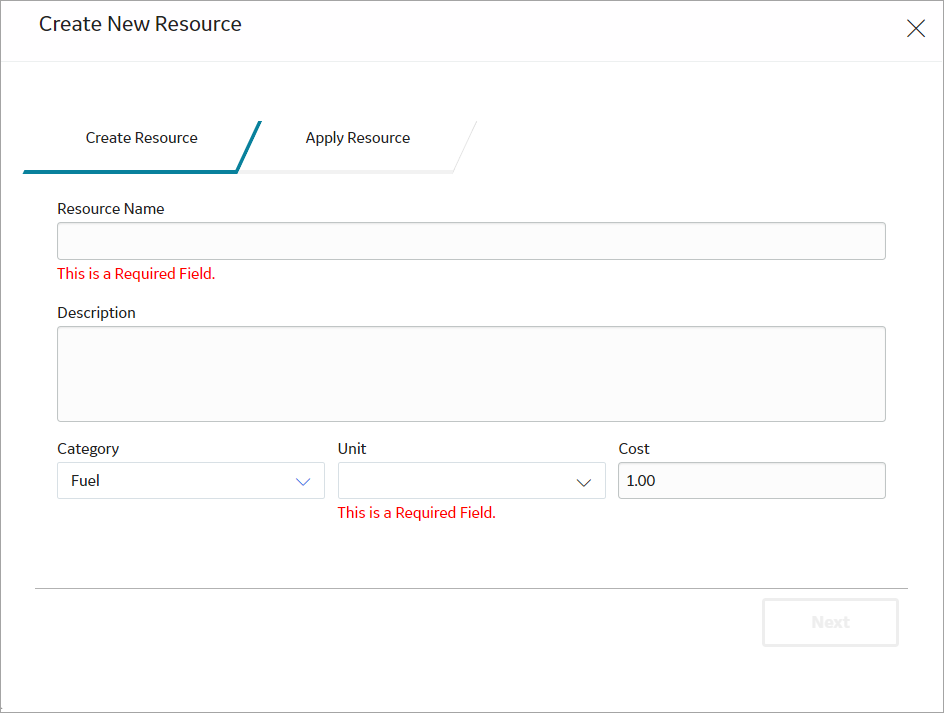
- As needed, enter values in the available fields, and then select Next.The Apply Resource section appears.
Add an Existing Resource
Procedure
- In the cell for the Cost Element to which you want to add a resource, select , and then select Add Existing Resource.The Select Resources section appears.
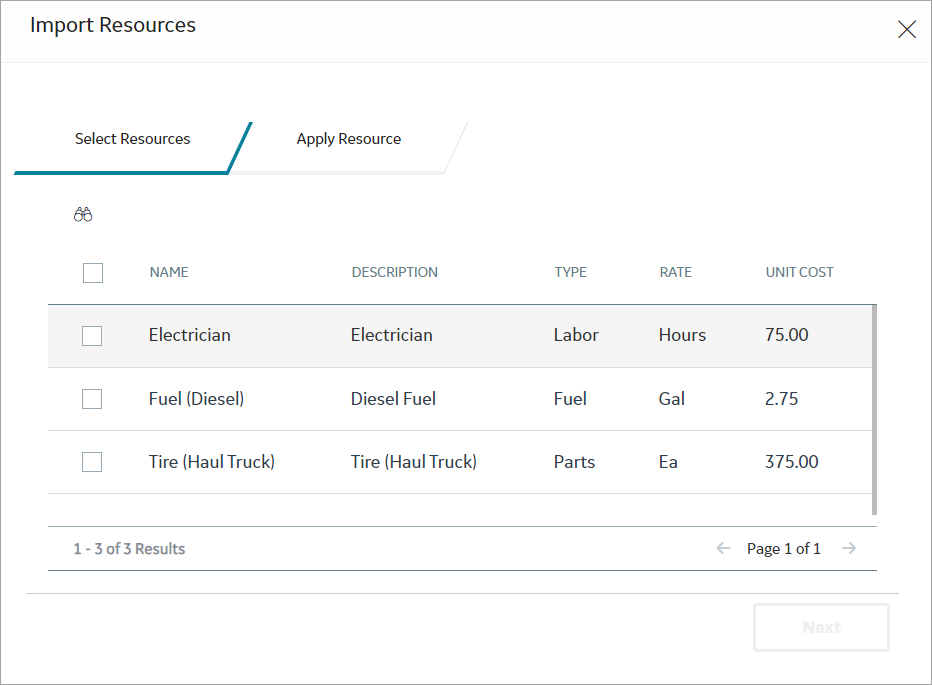
- Enter values in the Quantity, Consumption Unit, Period Usage, and Periods boxes.If you want to add another resource, select.
Create a Secondary Element in the Cost Data Grid
Procedure
- In the primary element cell, select .
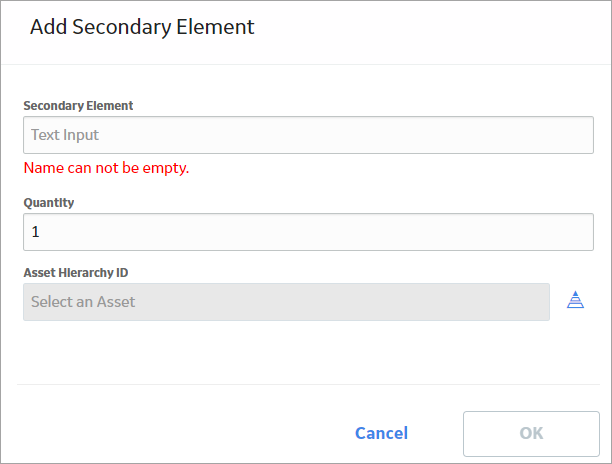
The Add Secondary Element window appears.
- If you want to add an element that is listed in the hierarchy:
- Beside the Asset Hierarchy ID box, select
 .
.The Hierarchy window appears.
- Navigate to and select an Asset, and then select Done.
- Enter values in the Secondary Element and Quantity boxes.Note: Quantity, which has a default of 1, is used as a multiplier. For example, if the quantity is equal to 10, all of the operating and capital costs are multiplied by 10.
- On the Add Secondary Element window, select OK.
-or-
If you want to add an element that is not listed in the hierarchy:
- Enter values in the Secondary Element and Quantity boxes, and then select OK.Important: When adding an asset not listed in the hierarchy, the import features may not have the context needed to function and will return null results.
The secondary element appears in the Cost Data grid.
- Beside the Asset Hierarchy ID box, select
Copy a Secondary Element
Procedure
- In the upper-right corner of the Cost Data section, select
 .
.The Copy selected item? dialog box appears, asking you to confirm that you want to copy the selected secondary element.
Create Operating Costs Manually
Procedure
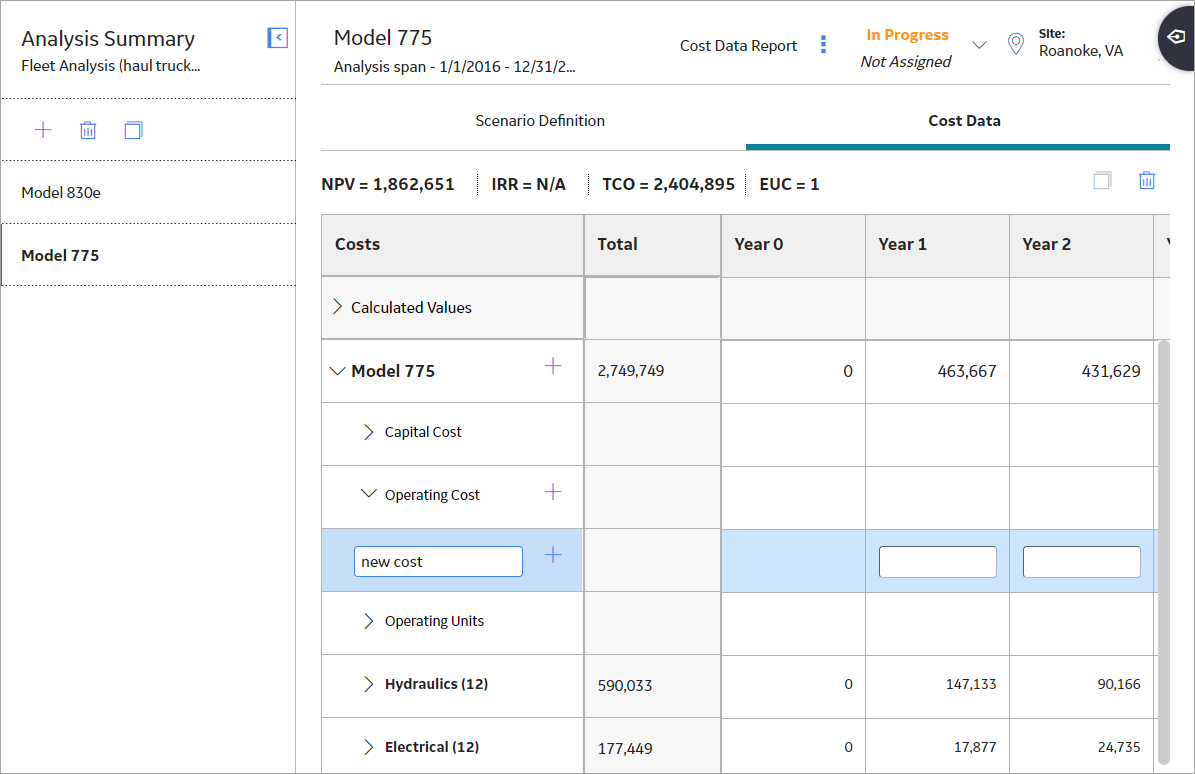
- Create a Blank Row
- In the Operating Cost cell, select , and then select Blank Row.A new row appears.
- In the Operating Cost cell, select
- Create a Known Interval/Cost
- In the Operating Cost cell, select , and then select Known Interval/Cost.The Add Known Interval Cost window appears.
- In the Operating Cost cell, select
- Create a Distributed Cost
- In the Operating Cost cell, select , and then select Distributed Cost.The Add Distributed Cost window appears.
- In the Operating Cost cell, select
Import Cost Data
About This Task
Procedure
- Import Work History
- In the element section to which you want to add cost data, in the Operating Cost cell, select , and then select Import Data.
The Import Operating Cost Data window appears.
- Select Next.Based on the assets associated with the element, a list of work history events and their associated event types and costs appears.
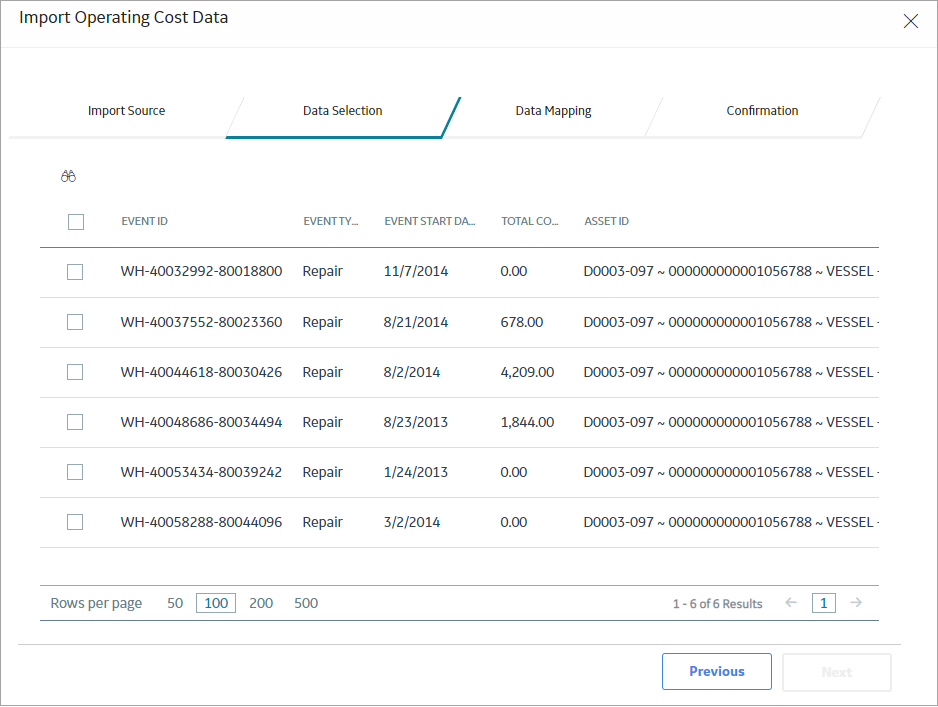
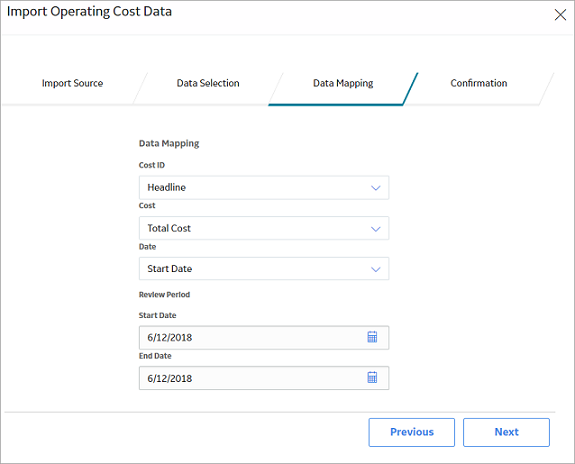
- Select the work history events that you want to import, and then select Next.The Data Mapping section appears.
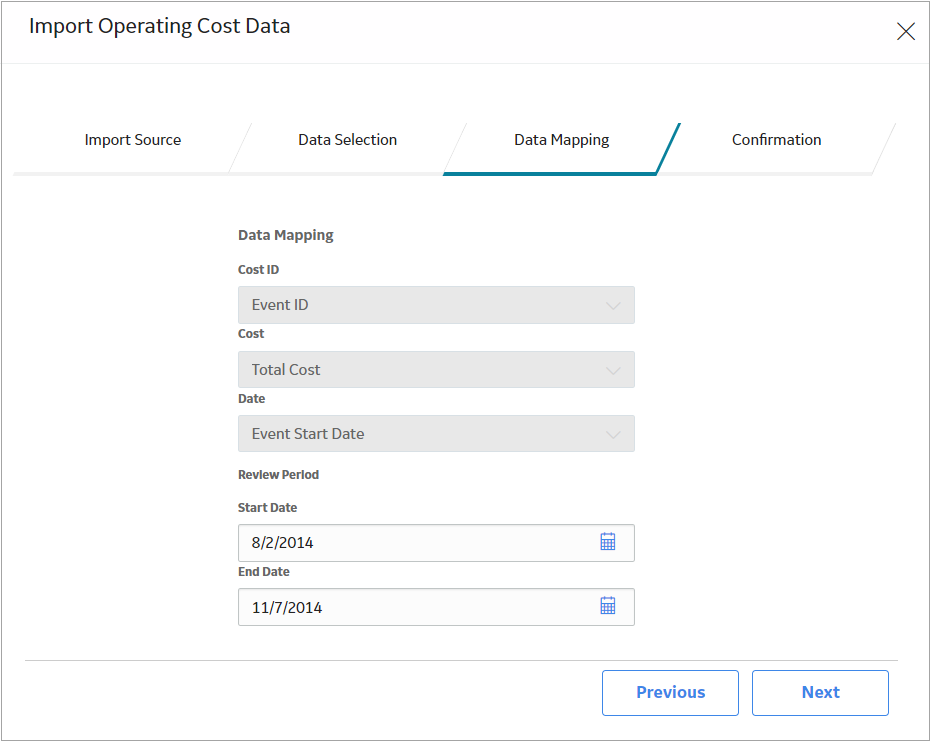
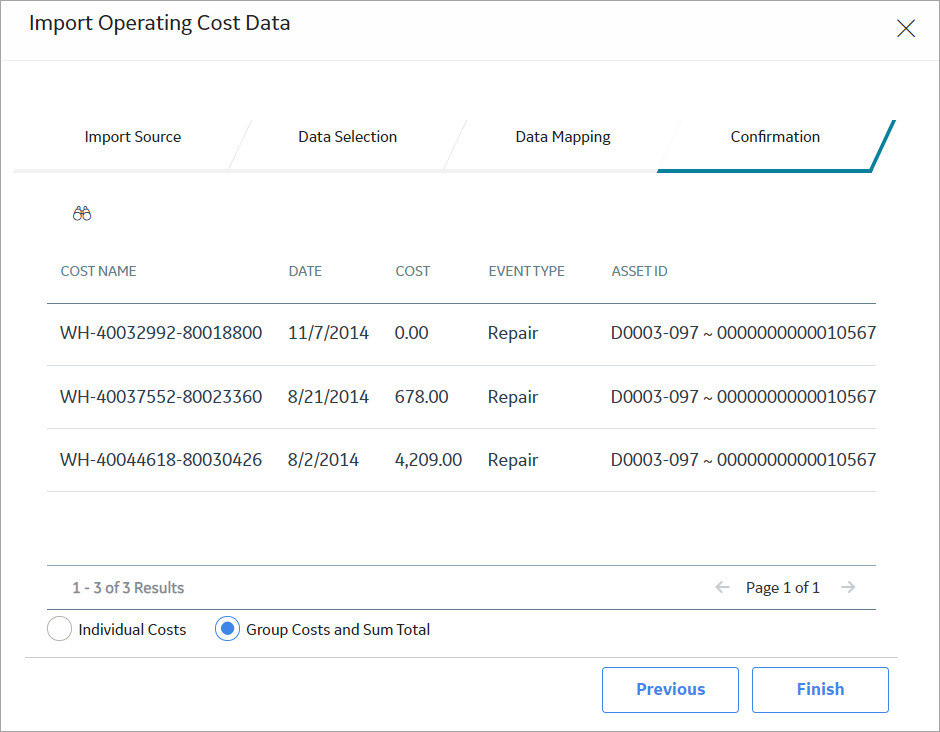
- In the Start Date and End Date boxes, select dates to set the Review Period for the events you are importing, then select Next.A list of the costs that you are importing appears.
- In the element section to which you want to add cost data, in the Operating Cost cell, select
- Import Strategy Action Costs
- In the element section to which you want to add cost data, in the Operating Cost cell, select , and then select Import Data.
The Import Operating Cost Data window appears.
- Select Next.A list of Strategy Actions related to the asset or asset group selected in the primary or secondary element appears.
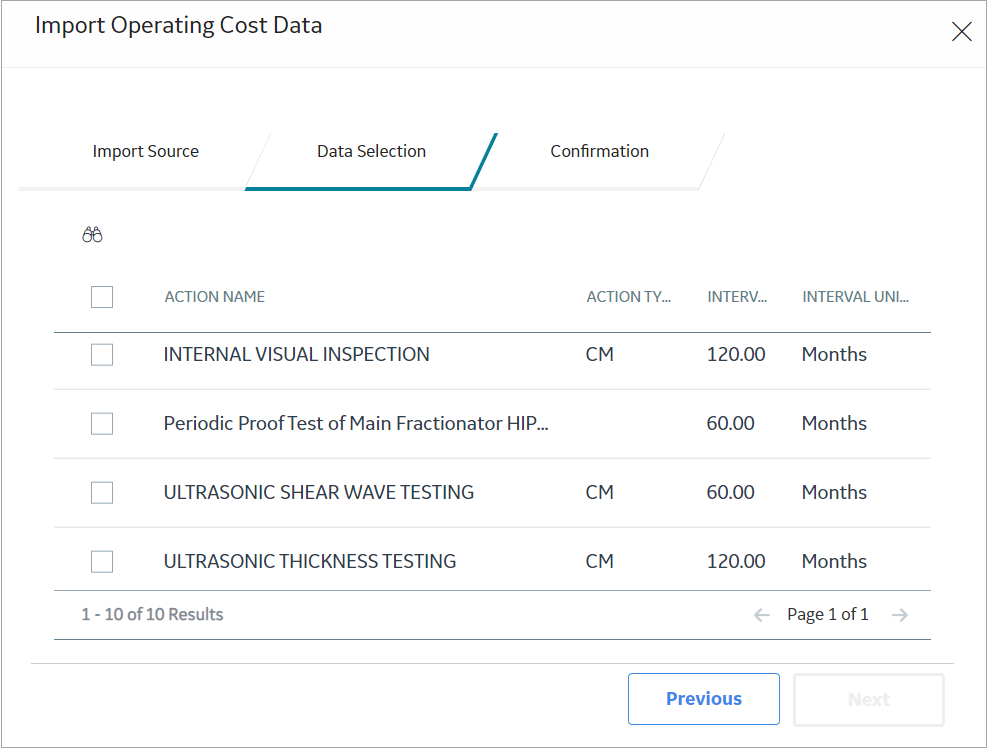
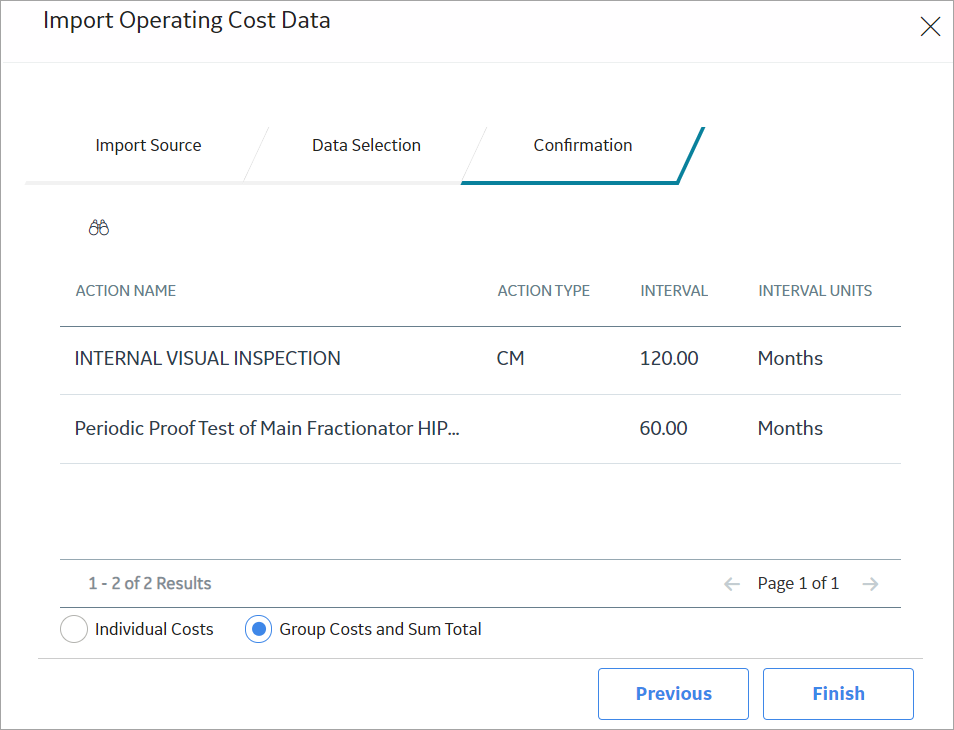
- Beside each Strategy Action that you want to import, select the check box, and then select NextThe Strategy Actions associated with the asset will only appear in the list if the strategy is currently active.The Confirmation screen appears displaying the list of Strategy Actions that you selected and their associated costs.
- In the element section to which you want to add cost data, in the Operating Cost cell, select
- Import Production Event Costs
- In the element section to which you want to add cost data, in the Operating Cost cell, select , and then select Import Data.
The Import Operating Cost Data window appears.
- Select Next.A list of Production Events appears based on the event, where the causing asset has been associated with either primary or secondary elements.
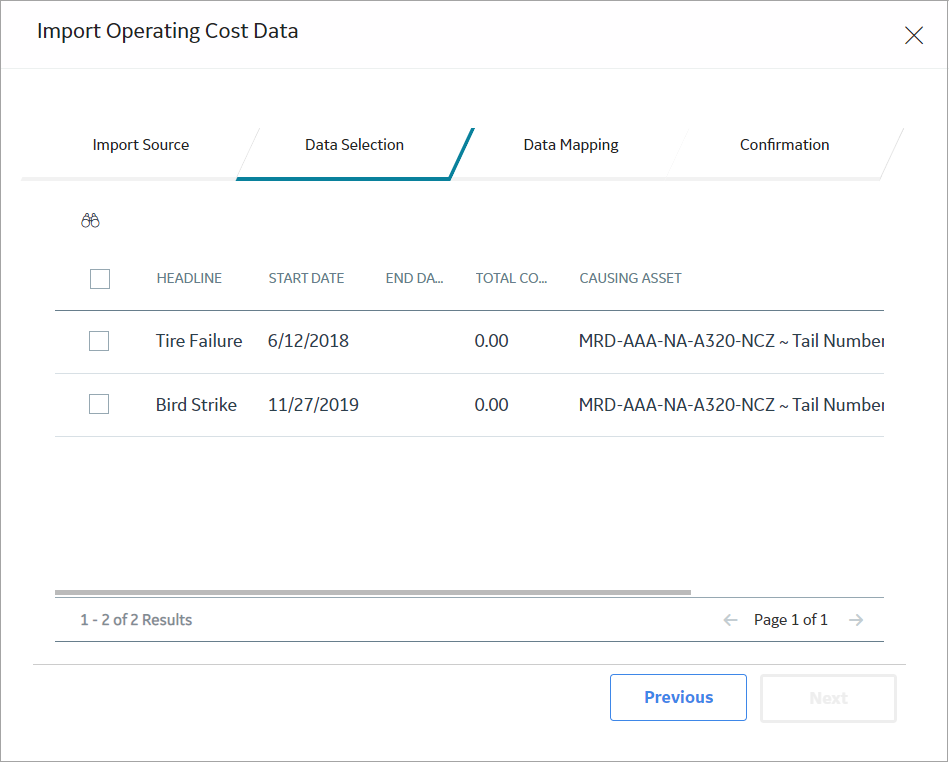
- Beside each Production Event that you want to import, select the check box, and then select Next.The Data Mapping section appears.
- In the element section to which you want to add cost data, in the Operating Cost cell, select
- Import a Dataset
- In the element section to which you want to add cost data, in the Operating Cost cell, select , and then select Import Data.
The Import Operating Cost Data window appears.
- Select Browse.The Select a Dataset from the catalog window appears.
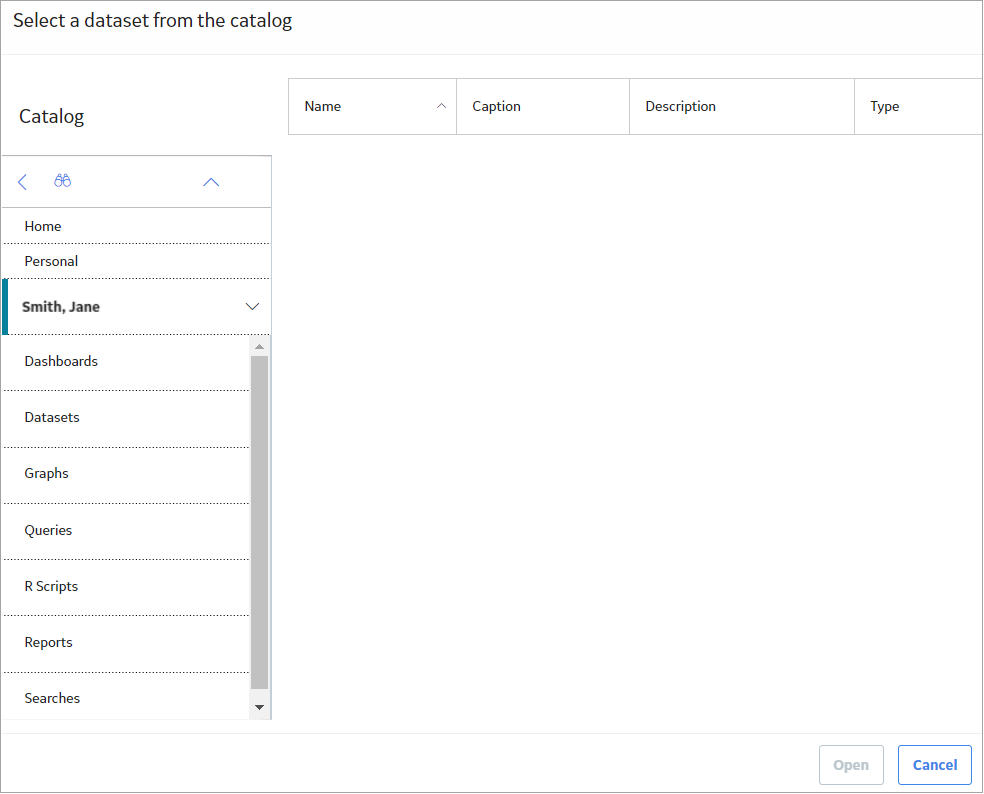
- Select Next.Data from the the selected dataset is displayed.
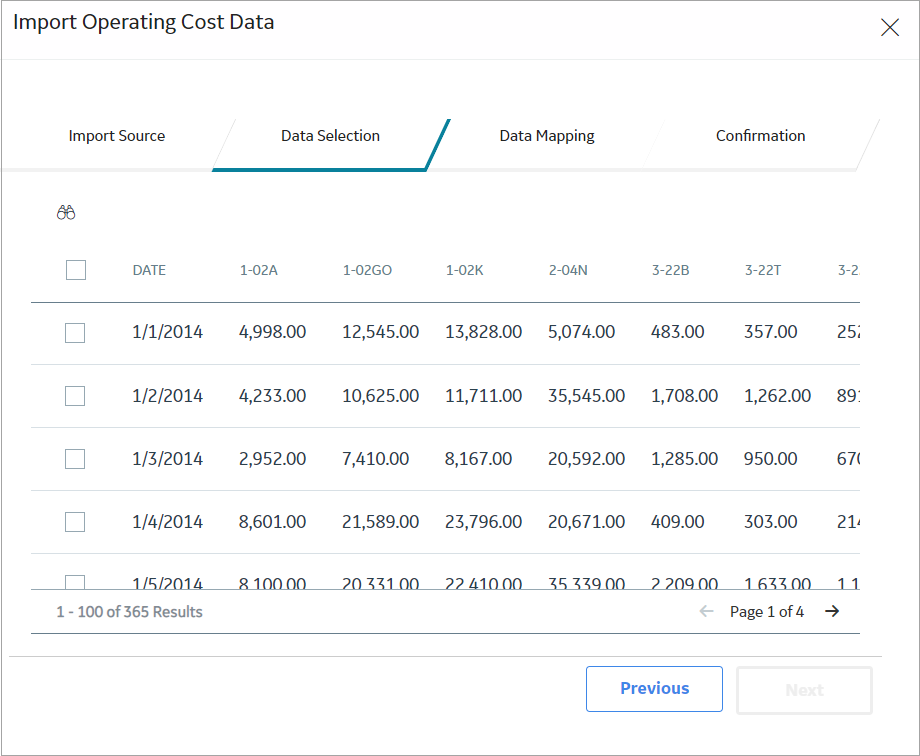
- In the element section to which you want to add cost data, in the Operating Cost cell, select
Access Calculated Values
About This Task
Calculated Values are available in the Cost Data grid for each scenario and for each period within each scenario. For information on the formulas used to calculate the values, refer to the Rates and Calculations section.
Procedure
Add Capital Costs to the Cost Data Grid
About This Task
In LCC, you have the ability to add the value or cost of an asset into the calculation using the Capital Cost section of the Cost Data grid. The added capital costs are depreciated according to the method and rate determined in the analysis model. Capital Costs can be added at the Primary and Secondary Element levels.
Initial Values are entered at Year 0 and are not treated as costs or revenue, as they are the value of the element at T0 before the analysis. The total capital cost for an element is the sum of rows underneath it, excluding the initial value row, salvage value row, and depreciated value row.
Capital Costs are added to the depreciated value of the element and the Depreciated Value sum shown in the calculated values for the period. Capital costs and Initial Value are depreciated to the Salvage Value in the period in which the salvage is taken.
Procedure
- Expand the Capital Cost section.