 Operations Hub
Graph
Graphs are data visualizations that you can add to display data in an application.
This widget is available only in Operations Hub Classic version.
Graph Properties
To use a graph widget, in addition to the default settings, you must specify one of
the following types of graphs.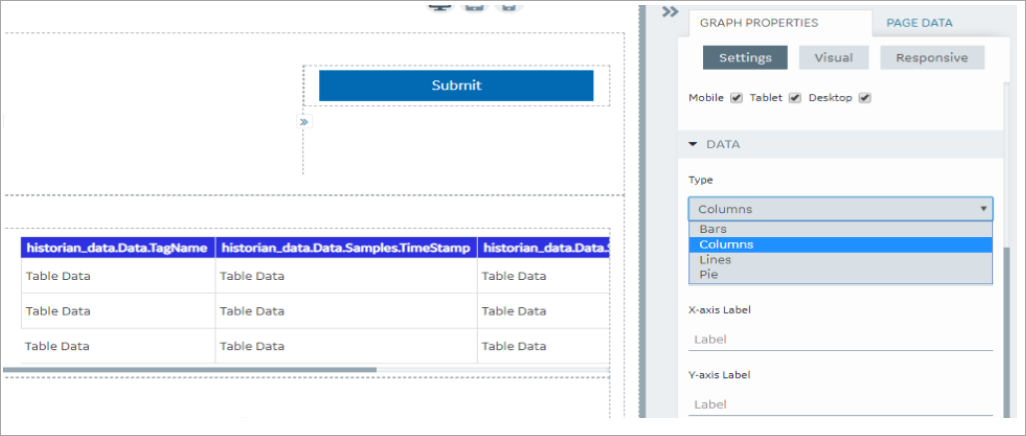
| Field Name | Description |
|---|---|
| X-axis Label | Displayed below the graph horizontally. |
| Y-axis Data | The data source for the bars. |
| Y-axis Label | Displayed on the left side of the bar graph. |
| Add All Fields | This will add all the columns from the chosen entity. Each column can be labeled independently. |
| Sort By | Since an entity can contain several different types of data, it is possible to sort the data depending on the data in an entity. |
| Field Name | Description |
|---|---|
| X-axis Label | Displayed below the graph horizontally. |
| X-axis Data | The data source for the columns. |
| Y-axis Label | Displayed on the left side of the graph. |
| Add All Fields | This will add all the columns from the chosen entity. Each column can be labeled independently. |
| Sort By | Since an entity can contain several different types of data, it is possible to sort the data depending on the data in an entity. |
| Field Name | Description |
|---|---|
| X-axis Label | Displayed below the graph horizontally. |
| X-axis Data | The data source for the lines. |
| Y-axis Label | Displayed on the left side of the graph. |
| Add All Fields | This will add all the columns from the chosen entity. Each column can be labeled independently. |
| Sort By | Since an entity can contain several different types of data, it is possible to sort the data depending on the data in an entity. |
| Field Name | Description |
|---|---|
| Value | The output value from the data source. |
| Title | The title of the graph widget is linked to a query tag property
field, enabling the title to be dynamically generated based on data
retrieved from the data source. Note: This field is
mandatory to generate a pie graph. |
| Sort By | Depending on the data, sorting may be necessary in order to highlight certain information. Once the sort feature has been selected, it is possible to select ascending or descending order. |
Possible Uses
Graphs are a way to show data visually. For example, if 50 students enrolled for a course, you can use a graph widget to show how their grades have changed over time or it may be beneficial to show what grades the students received by percent.
When you plot the data stored in the M2M Entities using a graph widget, timestamp values are displayed in the following format: hh:mm
Downloading Data from a Graph
You can download data from an entity in a Microsoft Excel worksheet using a graph widget. To do so, in the Graph Properties section, select the Allow Download check box. The download button appears in the upper-right corner of the widget in the application.
- Downloading occurs based on the query last executed as shown in the graph.
- If the query is executed for the specific date range using Input boxes, for example, data is downloaded based on the condition specified.
- The entity data connected to the graph is downloaded, not the graph itself.
- If multiple queries are connected to the graph, a separate Microsoft Excel worksheet is generated for each query, and it is downloaded in a single worksheet.
- In the
time_stamprelated fields of the M2M_data Entity, the values of milliseconds are also stored. However, only hour, minute, and second values can be displayed when you use the graph widget.