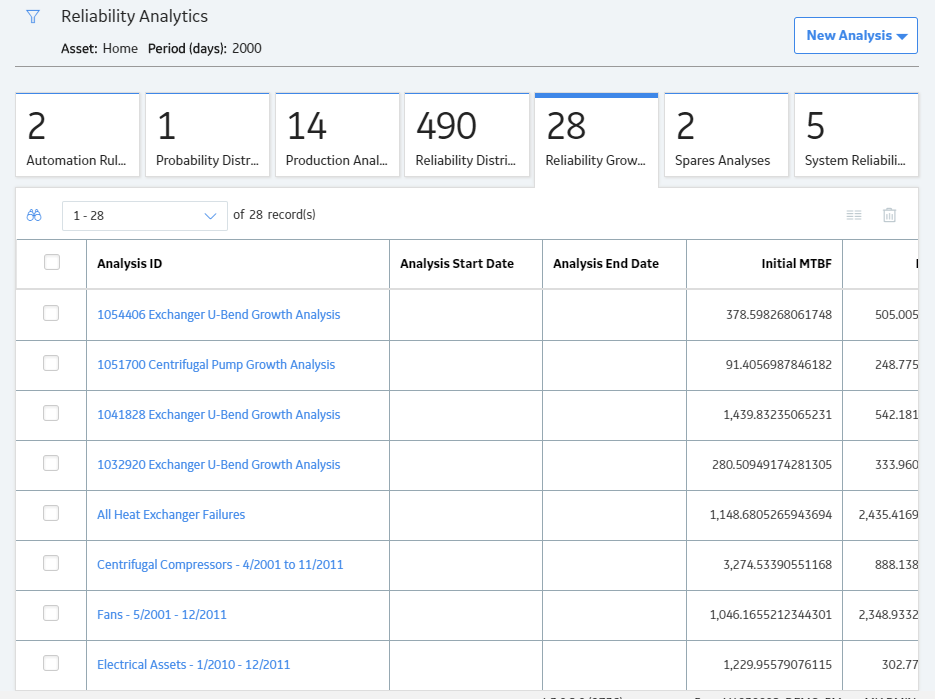
Select the Reliability Growth tab.
A list of Reliability Growth Analyses available in the database appears.

Next to the Analysis ID, select two or more Reliability Growth Analyses whose plots you want to compare.
Note: You can select up to 20 analyses to compare plots.
In the upper-right corner of the grid, select
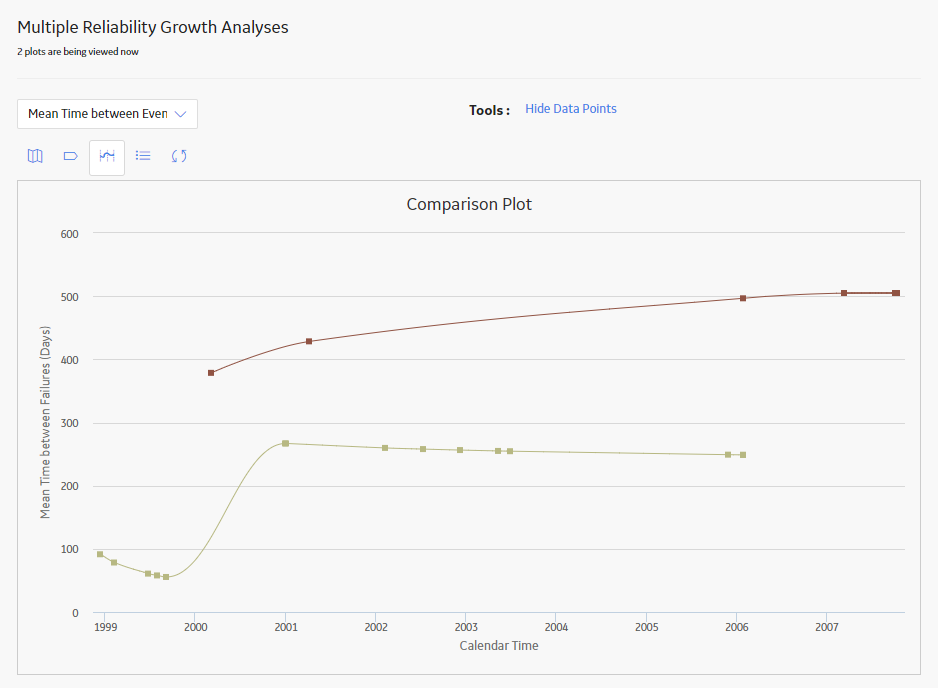
The Multiple Reliability Growth Analysis page appears, displaying the Comparison Plot. By default, Cumulative <Measurement> plot for the selected analyses appears. You can also view the following types of plots:
