Analysis ID
Character
The name of the Reliability or Probability Distribution Analysis associated with the Distribution record.
This field is populated automatically with the value in the Analysis ID field of the Reliability or Probability Distribution record to which the Distribution record is linked.
The name of the Reliability or Probability Distribution Analysis.
You can select the value that describes a piece of equipment for which you are performing an analysis. This field is required. Reliability Analysis can be conducted on any number of equipment.
Confidence Level
Number
Indicates the percentage of uncertainty in a Goodness of Fit method.
The confidence level is used to indicate that you want the model to fit with a particular level of certainty. This value is set to 90 by default. You can enter a value between one (1) and one hundred (100).
Field that contains the specific period during which the piece of equipment is not operating during the analysis period.
This field is optional but must be numeric. If this information is available, it can be used to make the estimation more accurate. Fields like "return to service date" or "date repaired" can be used to estimate downtime.
The field that contains the last date on which the piece of equipment failed. This data can have many different descriptions (e.g., Out of Service Date, Shutdown Date, or Failure Date).
This is field is required.
The mode of failure.
Sometimes users put failed parts in this field, or even a description like "worn out" or "broke down." These descriptions can be very useful when deciding to include or not include a particular failure in the failure history for purposes of censoring.
This field is not available on the datasheet.
Fit Method
Character
The type of method used to estimate distribution parameters.
In a Reliability Distribution Analysis, this value is displayed in the Distribution Options section in the Time to Repair Distribution and Time to Failure Distribution sections. In a Probability Distribution Analysis, this value is displayed in the Distribution Options section on the Analysis Summary workspace. The method of fit for a Distribution Analysis can be either Least Squares or Maximum Likelihood Estimators (MLE).
The field that contains the date on which the piece of equipment was installed.
You can select a date field. This field is optional.
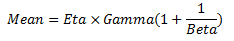
Mean
Number
The average point of the distribution. This is not necessarily the same as the average point of the dataset.
This value is calculated by the GE Digital APM system and is populated automatically. The value is calculated using distribution parameters, which vary depending on the type of distribution. For example, for a Weibuill distribution, this value is calculated using the following formula:
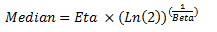
Median
Number
The middle point of the distribution. This is not necessarily the same as the middle point of the dataset.
This value is calculated by the GE Digital APM system and is populated automatically. The value is calculated using distribution parameters, which vary depending on the type of distribution. For example, for a Weibuill distribution, this value is calculated using the following formula:
Passed
Logical
Indicates whether the model passed the Goodness-of-Fit test or not.
A value of Yes or No that indicates if the fit test was successful (the distribution fits the data based on the test performed).
If the P-value is less than or equal to 1 minus the confidence level, the goodness of fit test has failed and this value is set automatically to No by the GE Digital APM system. Otherwise, the goodness of fit test is successful and this value is set to Yes.
Published
Logical
Indicates whether the analysis has been published.
If the analysis has been published, this value is set to True. If the analysis has not been published, this value is set to False.
P-Value
Number
The probability that the GOF Statistic is greater than the value in the Statistic field.
This value is calculated by the GE Digital APM system. The value used to determine whether the analysis passed the goodness of fit (GOF) test. The P-value is interpreted as the probability that the test statistic is due to random error. Typically, the higher the P-value, the more likely the model is appropriate and the more likely that the fit will pass the test.
Random Variable
Character
The name of the independent variable, which associates a numerical value with every event (e.g., Downtime).
This value is only populated for a Distribution record associated with a Probability Distribution Analysis. This value is populated automatically with the value you specify in the Random Variable box on the Specify the Random Variable window.
R-Squared
Number
The R-Squared Correlation Coefficient, which describes the strength of a linear model.
This value is calculated by the GE Digital APM system and populated automatically. This value measures how closely the points fall to the least squares line, providing an indication of how confident one can be of predictions made with the line. An R-Squared value greater than 0.9 is considered a good fit for linear regression.
Standard Deviation
Number
The variability of the random variable around the mean.
This value is calculated by the GE Digital APM system and populated automatically.
Statistic
Number
A value that indicates the preciseness of the fit of the data to the model.
This value is calculated automatically by the GE Digital APM system. Typically, the lower the GOF Statistic, the better the fit.
Time Units
This field contains a list of the following values:
-
Hours
- Days
- Weeks
- Months
- Quarters
- Years
The time units that you select here will apply to downtime only.
Units of Random Variable
Character
The time units associated with the independent variable.
This value is associated with the value in the Variable field. This value is only populated for a Distribution record associated with a Probability Distribution Analysis. This value is populated automatically with the value you specify in the Units box on the Specify the Random Variable window.