 Historian
Retrieval
Retrieval
When retrieving data from Historian, you specify either a raw or non-raw sampling mode. Non-raw retrieval can include a calculation mode so that calculations are performed in the archiver before data is returned. This is detailed in the following sections:
- Sampling Modes
- Hybrid Modes
- Filtered Data Queries
Some sampling and calculation modes are better suited to retrieving compressed data. Understanding the available modes helps you choose the best method for your archiving process.
- API
- SDK
- OLE DB
- Charting
- Reporting via OLE DB and Excel Add In
Sampling Modes
Many different sampling and calculation modes can be used on retrieval of data that has already been collected in the archive. Available sampling modes in Historian include:
These topics explain some of these retrieval concepts. Each sampling mode (except calculated) is described with details and examples, including how sample attributes are determined. Each sample returned by Historian during data retrieval has the following properties:
- Timestamp time stamp of the collected sample or an interval time stamp
- Value The collected value or sampled value
- Quality Each sample in Current Value and Raw retrieval has a quality of "good" or "bad". Interpolated and Lab Retrieval express quality as a "per cent good".
Current value sampling is the simplest retrieval mode. Raw data retrieval is the second simplest method of retrieval. Intervals and interpolation concepts are common to Interpolation and Lab sampling. Interpolation and lab sampling are presented together so that they can be contrasted for values and qualities returned from the same set of collected data.
Example Data: Each topic contains all necessary data for executing each example in the form of a CSV file that can be imported by the Historian File collector. You will have to copy and paste the appropriate data into a separate file with a CSV file name extension. Delete all archives before importing the data. You will not be able to import the data unless you adjust the active hours setting; this is true any time you import old data with the File collector. For details, see Historian documentation.
Current Value Sampling Mode
Current Value Sampling Mode retrieves the data sample value with newest timestamp of any quality that was received by the archiver. This is not the same as retrieving the newest raw sample stored in the archive, since archive compression sometimes discards raw samples sent by the collector during the compression process.
Current Value Sampling retrieves a single sample containing the current value of the tag, not a series of historical samples. The sample has a timestamp, value, and quality.
Timestamp
Returns the time stamp on the sample sent to the archiver. The time stamp is not necessarily the current time. If collector compression is enabled and the deadband on the collector has not been exceeded for some time, the time stamp may be much earlier than the current time.
If data is sent to the archiver out of order, the current value is always the newest timestamp, even when the most recent value received is older than previous samples.
Retrieving the current value of out of order data
- Import this file that contains out of order data for a
tag
* Example of Out Of Order data * [Tags] Tagname,DataType,HiEngineeringUnits,LoEngineeringUnits OUTOFORDERTAG,SingleFloat,60,0 [Data] Tagname,TimeStamp,Value,DataQuality OUTOFORDERTAG,29-Mar-2002 14:50:00.000,50.0,Good OUTOFORDERTAG,29-Mar-2002 14:20:00.000,20.0,Good OUTOFORDERTAG,29-Mar-2002 14:30:00.000,30.0,Good OUTOFORDERTAG,29-Mar-2002 14:10:00.000,10.0,Good - Retrieve the data using current value sampling, using the following
query:
select timestamp, tagname, value, quality from ihrawdata where samplingmode = CURRENTVALUE and
tagname = OUTOFORDERTAG
The time stamp of the current value should be the newest timestamp with the value and quality that was sent to the archiver, as shown here:
| Timestamp | Tagname | Value | Quality |
|---|---|---|---|
| 29-Mar-200214:50:00.000 | OUTOFORDERTAG | 50.00 | GoodNonSpecific |
- Value: Simply the value sent by the collector. The value is not interpolated to the current time or modified by the archiver during retrieval. The data type of the value will be the same data type as the tag's raw data.
- Data Quality: Returns the quality of the data sent by the collector. The current value can be of a bad data quality and will be flagged if the collector sends a sample with a bad data quality to the archiver. When the collector shuts down cleanly, it sends a bad data quality marker at shutdown time for all its tags. If the collector simply loses its connection to the archiver or crashes, the current value's quality will not automatically change to bad.
Retrieving the current value of a tag
The following sequence of steps displays the behavior of Current Value sampling mode. After each step, retrieve the tag current value using this query:
select timestamp, tagname, value, quality from ihrawdata where samplingmode = CURRENTVALUE and
tagname = IFIX.RAMP.F_CV- Configure the tag
IFIX.RAMP.F_CVin an iFIX collector running on different PC than archiver. Configure it to have a one-second collection interval. The Current Value should be within one second of the value shown in a data link. - Stop the iFIX collector. The end-of-collection marker is sent to the data, so the Current Value quality should be marked as bad and its value set to zero.
- Restart the iFIX collector. The Current Value quality should be marked as good and it should have a valid value.
- Put the block off scan in the PDB. The Current Value quality should be marked as bad. (Put the block back on scan when you've verified this.)
- Pull the network cable from the iFIX collector running on another machine. The current value remains unchanged as the value was good at the time the cable was pulled. To ensure that the Current Value is accurate, you would have to use the Heartbeat Address of the iFIX collector to verify that the collector is running.
- Enable collector compression for the point and ensure that the tag's value does not change. The time stamp of the current value will stay the same until the collector reports a change.
Anticipated Usage
The current value can be used in any operator display. You should also display the data quality of the current value. You may choose to use the Heartbeat address of the collector so that you can confirm that the collector is running and that the current value is therefore up to date.
If the collector was shut down gracefully, then the current value would correctly display a bad data quality (and a value of 0). If the collector crashed or was disconnected from the server, then the current value will be the last value sent before the crash or disconnect.
Lab Sampling Mode
Lab Sampling is designed to duplicate the way iFIX classic Historian (HTA/HTC) returned data. This sampling mode returns only collected values. Each collected value is repeated until the next collected value, resulting in a jagged step plot instead of a smooth curve.
Interpolated values are used in other calculation modes. Lab sampling is never used by calculation modes. Each sample has the following attributes:
- Timestamp - Lab sampling determines intervals and timestamps the same as interpolated retrieval.
- Value - Any value returned is an actual collected raw value; the data value is never interpolated.
- Data Quality - Lab sampling uses the same logic as interpolated sampling to determine percent good quality.
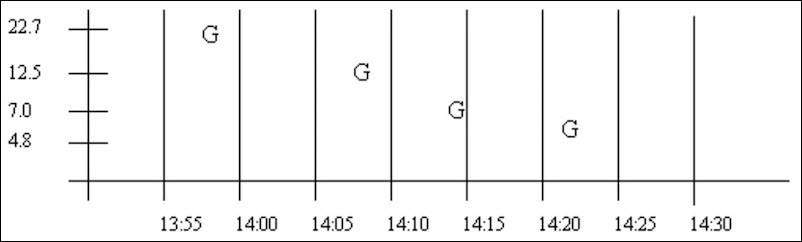
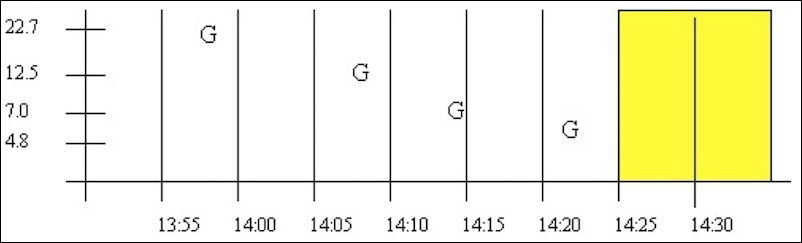
Retrieving lab sample values of an interval with GOOD data
lab.
select timestamp, value, quality from
                ihrawdata where samplingmode=lab and timestamp >= '29-Mar-2002 13:50' and
                timestamp <= '29-Mar-2002 14:30' and tagname = tag1 and numberofsamples =
8| Timestamp | Value | Quality |
|---|---|---|
| 29-Mar-200213:55:00.000 | 0.00 | 0.00 |
| 29-Mar-200214:00:00.000 | 22.70 | 100.00 |
| 29-Mar-200214:05:00.000 | 22.70 | 100.00 |
| 29-Mar-200214:10:00.000 | 12.50 | 100.00 |
| 29-Mar-200214:15:00.000 | 7.00 | 100.00 |
| 29-Mar-200214:20:00.000 | 7.00 | 100.00 |
| 29-Mar-200214:25:00.000 | 4.80 | 100.00 |
| 29-Mar-200214:30:00.000 | 4.80 | 100.00 |
The value is never anything other than a collected value. This differs from interpolated sampling. A plot of this data would look like a series of steps, rather than a smooth, interpolated curve.
Anticipated Usage: Since lab sampling returns real, collected values, it is more accurate when a sufficient number of raw samples are stored. Use interpolated sampling for highly compressed data. It is generally not useful with archive compression. Collector compression can be used to filter out non-changing values, but a high deadband reduces the number of raw samples and therefore reduces the accuracy of lab sampling.
Interpolated Sampling Mode
This topic describes interpolated retrieval mode. It also presents concepts that are common to interpolated, lab, calculated, and trend retrieval modes. Interpolation is a separate sampling mode and is also used in the various calculation modes.
Data compression necessitates interpolation. A minimal number of real data points is stored in the archive. On retrieval, interpolation is performed to produce an evenly spaced list of the most likely real world values. Even if you are not using compression, you can use interpolation if you want samples spaced on intervals other than the "true" collection rate.
The following data is used in the examples below. You can import this data into Historian if you want to try the examples yourself:
*Example for Interpolated Data Documentation
*
[Tags]
Tagname,DataType,HiEngineeringUnits,
LoEngineeringUnits TAG1,SingleFloat,60,0
BADDQTAG,SingleFloat,60,0
[Data]
Tagname,TimeStamp,Value,DataQuality
TAG1,29-Mar-2002 13:59:00.000,22.7,Good
TAG1,29-Mar-2002 14:08:00.000,12.5,Good
TAG1,29-Mar-2002 14:14:00.000,7.0,Good
TAG1,29-Mar-2002 14:22:00.000,4.8,Good
BADDQTAG,29-Mar-200213:59:00.000,22.7,Good
BADDQTAG,29-Mar-2002 14:08:00.000,12.5,Bad
BADDQTAG,29-Mar-2002 14:14:00.000,7.0,Bad
BADDQTAG,29-Mar-2002 14:22:00.000,4.8,Good
Timestamp
All sampling and calculation modes (except raw sampling) use the same method for creating intervals from the start and end time. Raw retrieval has no intervals, only a start and end time. Each mode differs in how it arrives at the value to assign to that interval
The simplest case is when the interval is evenly divisible by the number of samples or by the interval in milliseconds. For example, the start and end times are one hour apart and you want data at ten-minute intervals, or 6 samples. The first time stamp occurs at the start time + one interval and represents the samples from a point greater than the start time to less than or equal to the interval time stamp.
Determining interval timestamps for evenly divisible duration
- Import this data into the Historian. There is only a tag, with no
data.
[Tags] Tagname,DataType,HiEngineeringUnits,LoEngineeringUnits c1,SingleFloat,100,0 - Retrieve data for that tag over a 1-hour duration with a 10-minute interval. Use
the following
query:
select timestamp from ihrawdata where timestamp >= 14:00 and timestamp <= 15:00 and tagname = c1 and
numberofsamples = 6
or this query
select timestamp from ihrawdata where timestamp >= 14:00 and timestamp <= 15:00 and tagname = c1 and
Intervalmilliseconds = 10M
3/29/2002 14:10:00
3/29/2002 14:20:003/29/2002 14:30:00
3/29/2002 14:40:00
3/29/2002 14:50:00
3/29/2002 15:00:00
When the 1-hour duration is not evenly divisible, interval timestamps will include milliseconds even if the data samples do not use a resolution of milliseconds.
Example: Determining interval timestamps for a non-divisible duration
select timestamp from ihrawdata where timestamp >= 14:00 and timestamp <= 15:00 and tagname = c1 and
numberofsamples = 7
3/29/2002 14:08:34.285
3/29/2002 14:17:08.571
3/29/2002 14:25:42.857
3/29/2002 14:34:17.142
3/29/2002 14:42:51.428
3/29/2002 14:51:25.714
3/29/2002 14:59:59.999Value
- Attribute samples to intervals
- Any raw sample is attributed to exactly one interval based on the raw sample and interval time stamp. The rule is that the sample has to have a time stamp greater than the interval start time, but less than or equal to the end time. This is because the end timestamp of the interval is the start timestamp on the next interval.
- Interpolate a value at each interval end time
- For each interval end time, find the raw point before and after the end time. The interval time stamp is the interval end time; we can then interpolate the value at that time.
Determining interval interpolated value
This example shows how linear interpolation determines the most likely real world value at the interval timestamp.
Using the same data set as above, there are raw points at:
14:08:00.000,12.5,Good
14:14:00.000,7.0,Good
and you are trying to get an interpolated value at 14:10. The calculation used for linear interpolation would be:
interpolated value = previous raw sample + ((deltaY/deltaX) * offset)Substituting the numbers for this example:
deltaY = 7.0 12.5 = -5.5
deltaX = 14-8 = 6
offset = 2 seconds (from 14:08 to 14:10)
Interpolated value = 12.5 + ((-5.5/6)*2) = 10.67
- About Interpolated Data Type
- When interpolating data, the data type of the value will be the same data type as that of the tag's raw data. Only floating point and double floating point values can be interpolated. Integers, strings, and blobs cannot be interpolated. When attempting to interpolate string and integer data, interpolation will simply repeat the collected value for each interval until the next collected value.
Retrieving interpolated values of an interval with GOOD data
The raw samples for TAG1 can be plotted as follows. The ???G indicates a good data quality raw sample.
select timestamp, value, quality from ihrawdata where samplingmode=interpolated and timestamp >=
'29-Mar-2002 13:50' and timestamp <= '29-Mar-2002 14:30' and tagname = tag1 and numberofsamples = 8| Timestamp | Value | Quality |
|---|---|---|
| 29-Mar-2002 13:55:00.000 | 0.00 | 0.00 |
| 29-Mar-2002 14:00:00.000 | 21.57 | 100.00 |
| 29-Mar-2002 14:05:00.000 | 15.90 | 100.00 |
| 29-Mar-2002 14:10:00.000 | 10.67 | 100.00 |
| 29-Mar-2002 14:15:00.000 | 6.73 | 100.00 |
| 29-Mar-2002 14:20:00.000 | 5.35 | 100.00 |
| 29-Mar-2002 14:25:00.000 | 4.80 | 100.00 |
| 29-Mar-2002 14:30:00.000 | 4.80 | 100.00 |
There may be many raw points in an interval, but interpolation uses only the last one in the interval and the first one in the next interval. The sections below describe the interpolation behavior in the 3 possible cases.
- Case 1: Good Data Samples Before and After the Interval Timestamp
This is the typical case when compression is not used. There are 2 good data quality raw points. With interpolation, calculate the slope and offset of this line and interpolate the value at the interval timestamp. The 14:10 interval has a sample at 14:08 and at 14:14.
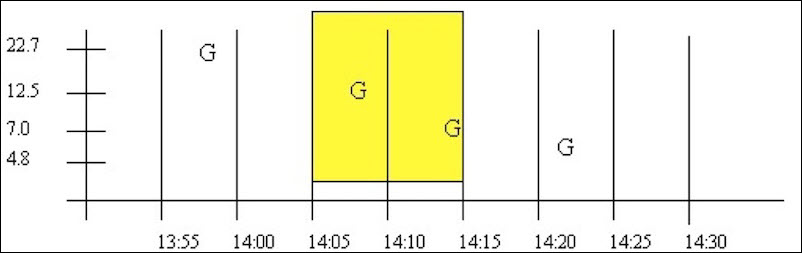
- Case 1a: Good Data Samples between the Interval Timestamp and the Start and End Time
In a similar case, there may be intervals with no raw samples, such as when data compression is used. Here, there is at least 1 good raw sample between the start time and interval, and at least 1 good raw sample between the interval and end time. The good raw samples are interpolated across intervals to determine values at the 14:00 and 14:05 intervals:
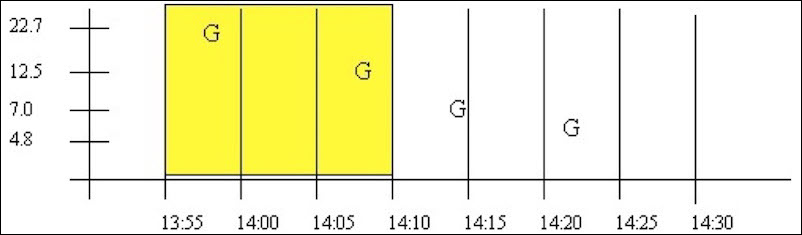
- Case 2: No Good Data between Start Time and Interval Timestamp
If no or bad data occurs before the interval, then the interval is given a bad data quality. The 13:55 interval is an example of this. Note that bad data is treated identically to no data.
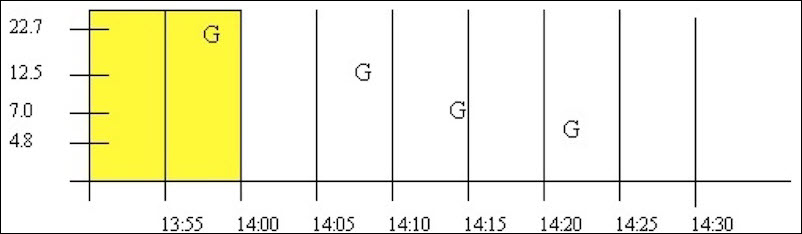
- Case 3: No Good Data between Interval Timestamp and End Time
If no or bad data occurs after the interval then the interval is given a good data quality, but the value is simply stretched instead of interpolated. The 14:25 interval is an example of this. Note that bad data is treated identically to no data. Good data quality is attributed to the 14:30 interval
Data Quality
Unlike CurrentValue, RawByTime, and RawByNumber, Interpolated data does not assign an individual data quality to each returned sample. Since Interpolated, Lab, and Calculated retrieval modes can contain multiple samples in an interval, the data qualities of each point are combined and summarized as a percent good value.
Interpolated and Lab sampling determine the percent good using the same procedure, resulting in a value of either 100 or 0 (though the determined value may be different for each mode even with the same data). Intermediate percent good values are determined only for Calculated retrieval modes.
The following examples illustrate interpolated and lab sampling modes. For each example, you can see that the behavior is the same for lab and interpolated sampling by changing samplingmode=Interpolated to samplingmode=lab.
Interpolated and Lab retrieval resulting in percent good of 100
This example illustrates the effect of bad data quality samples on the percent good statistic for an interval. The start and end times vary so that bad samples are included or excluded, which affects the percent good statistic
The data for BADDQTAG can be plotted as follows. The
G is used to indicate a good data quality raw sample and the
B indicates a sample of bad data quality. A query of the whole
data set is shown.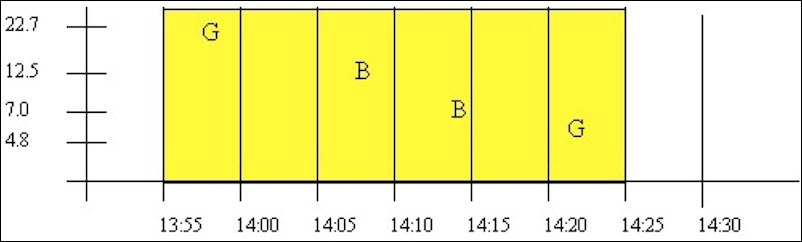
Using this query for a period starting with good data quality:
select timestamp, value, quality from ihrawdata where samplingmode=interpolated and timestamp >=
'29-Mar-2002 13:55' and timestamp <= '29-Mar-2002 14:25' and tagname = baddqtag and numberofsamples = 1
This results in the following data quality:
| Timestamp | Value | Quality |
|---|---|---|
| 29-Mar-200214:25:00.000 | 4.80 | 100.00 |
The percent good is 100. Even though the interval contains bad data quality samples, the interval does not end with bad data quality. Percent good is determined this way because the purpose of interpolation and lab sampling is to determine the value and quality at the interval timestamp. On the other hand, Calculation modes operate on the full set of raw samples within an interval and therefore result in percent good values between 0 and 100.
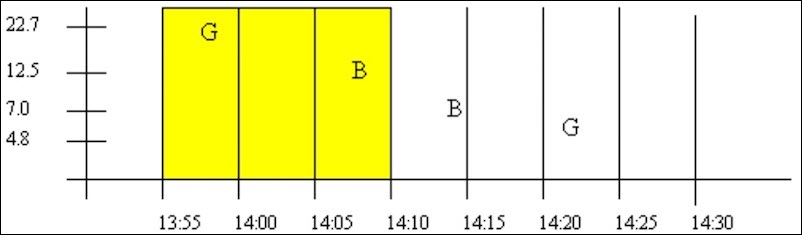
This interval from 14:10 to 14:25 starts with a bad data quality sample but ends with a good sample, so the results are the same. That is, the query:
select timestamp, value, quality from ihrawdata where samplingmode=interpolated and timestamp >=
 '29-Mar-2002 14:10' and timestamp <= '29-Mar-2002 14:25' and tagname = baddqtag and numberofsamples = 1
produces the same percent good result of 100.
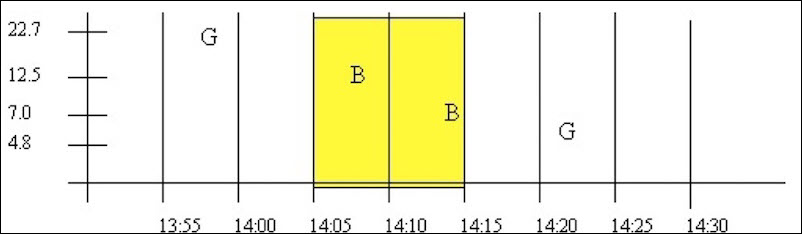
Example: Interpolated and Lab retrieval resulting in percent good of 0
This example shows some data patterns that result in a percent good of 0. An interval ending with a bad data quality sample, always results in a percent good of 0 for the interval.
| Timestsmp | Value | Quality |
|---|---|---|
| 29-Mar-2002 14:10:00.000 | 0.00 | 0.00 |
select timestamp, value, quality from ihrawdata where samplingmode=interpolated and timestamp >=
'29-Mar-2002 13:55' and timestamp <= '29-Mar-2002 14:10' and tagname = baddqtag and numberofsamples = 1| Timestamp | Value | Quality |
|---|---|---|
| 29-Mar-2002 14:10:00.000 | 0.00 | 0.00 |
Example: Interpolated and Lab retrieval of an empty interval
The data quality of an empty interval depends on the previous and following raw samples. Intervals with a prior good data quality sample have a percent good of 100 and intervals preceded by a bad data quality sample (or no sample) have in a percent good of zero.
This query results in a percent good of 100:
select timestamp, value, quality from ihrawdata where samplingmode=interpolated and timestamp >=
 '29-Mar-2002 14:00' and timestamp <= '29-Mar-2002 14:05' and tagname = baddqtag and numberofsamples = 1
Both of these queries produce a percent good of 0. The first has no preceding sample and the second is preceded by bad data:
select timestamp, value, quality from ihrawdata where samplingmode=interpolated and timestamp >=
'29-Mar-2002 13:50' and timestamp <= '29-Mar-2002 13:55' and tagname = baddqtag and numberofsamples = 1
select timestamp, value, quality from ihrawdata where samplingmode=interpolated and timestamp >=
'29-Mar-2002 14:15' and timestamp <= '29-Mar-2002 14:20' and tagname = baddqtag and numberofsamples = 1
The lab retrieval at 14:15 has a value of 7 but quality of 0. Note that you should almost always ignore specific values when the percent good is 0.
Raw Data Sampling Modes
- RawByTime retrieval: Specify a start and end time for data retrieval. RawByTime returns all raw samples of all qualities with a time stamp greater than the start time and less than or equal to the end time. It will not return a raw sample with same time stamp as the start time. NumberOfSamples is ignored and all raw samples will be returned.
- RawByNumber Retrieval: Specify a start time, a number of samples, and a direction (forward or backward). RawByNumber retrieval returns X raw samples of all qualities starting from a time stamp of the indicated start time, moving in the specified direction. It will return a raw sample with the same time stamp as the start time. If there is no sample at the specified start time, the retrieval count begins at the next sample.
Each sample has the following attributes:
- Timestamp: The time stamp sent by the collector along with the raw sample.
- Value: The value sent by the collector along with the raw sample.
- Data Quality: The quality of data sent by the collector, as set by the collector.
Archive compression can reduce the number of raw samples stored in the archive. Archive compression may discard raw samples sent by the collector; these are not stored as raw samples and would not be returned by raw data retrieval.
If the current value has not been stored as a raw sample, will not be returned by a raw data retrieval.
If they exist within the requested time period, collected samples with a bad data quality and collector startup and shutdown markers will be returned in a raw data query.
RawByTime retrieval of samples over a period of replaced data
- Import this data into the
Historian.
[Tags] Tagname,DataType,HiEngineeringUnits,LoEngineeringUnits RAWTAG,SingleInteger,100,0 [Data] Tagname,TimeStamp,Value,DataQuality RAWTAG,29-Mar-2002 13:59:00.000,7,Good RAWTAG,29-Mar-2002 14:08:00.000,8,Bad - Import this data into the Historian so that there is replaced
data:
[Data] Tagname,TimeStamp,Value,DataQuality RAWTAG,29-Mar-2002 13:59:00.000,22,Good RAWTAG,29-Mar-2002 14:08:00.000,12,Bad RAWTAG,29-Mar-2002 14:22:00.000,4,Good - Retrieve the data using this RawByTime
query.
select timestamp, value, quality from ihrawdata where samplingmode=rawbytime and timestamp>='29-Mar-2002
13:59' and timestamp<='29-Mar-2002 14:22' and tagname=rawtag
The following results are obtained:
| Timestamp | Value | Quality |
|---|---|---|
| 29-Mar-200214:08:00.000 | 12 | Bad NonSpecific |
| 29-Mar-200214:22:00.000 | 4 | Good NonSpecific |
Note that the raw sample exactly at the start time is not returned and that the replaced value of 8 at 14:08 is not returned. If the start time is changed to 13:58:59, then all the samples are returned:
select timestamp, value, quality from ihrawdata where samplingmode=rawbytime and timestamp>='29-Mar-2002
13:58:59' and timestamp<='29-Mar-2002 14:22' and tagname=RAWTAG| Timestamp | Value | Quality |
|---|---|---|
| 29-Mar-200213:59:00.000 | 22 | Good NonSpecific |
| 29-Mar-200214:08:00.000 | 12 | Bad NonSpecific |
| 29-Mar-200214:22:00.000 | 4 | Good NonSpecific |
RawByNumber retrieval over a period of replaced data
The RawByNumber sampling mode returns up to a specified number of raw samples beginning at the start time. The end time is ignored. Unlike the RawByTime, this can return a sample that has the same time stamp as the start time. You must specify a direction forward or backward from the start time to retrieve data.
- Using the data imported by the previous example, retrieve 10 samples going
forward from 13:59:00.
select timestamp, value, quality from ihrawdata where samplingmode=rawbynumber and timestamp>='29-Mar-2002
13:59' and numberofsamples=10 and direction=forward and tagname=RAWTAG
The following results are obtained.
Timestamp Value Quality 29-Mar-200213:59:00.000 22 Good NonSpecific 29-Mar-200214:08:00.000 12 Bad NonSpecific 29-Mar-200214:22:00.000 4 Good NonSpecific - Using the data imported by the previous example, retrieve 10 samples going
backward from
14:22:00.
select timestamp, value, quality from ihrawdata where samplingmode=rawbynumber and timestamp<='29-Mar-2002
14:22' and numberofsamples=10 and direction=backward and tagname=RAWTAG
The following results are obtained.
Timestamp Value Quality 29-Mar-200214:22:00.000 4 Good NonSpecific 29-Mar-200214:08:00.000 12 Bad NonSpecific 29-Mar-200213:59:00.000 22 Good NonSpecific
Anticipated usage
You can use raw sampling to compute a raw minimum or raw maximum over a time period. Raw Average is already provided as a native calculation mode
You can also use raw sampling to analyze system efficiency. Count the number of raw samples per period of time, ignoring the values, then compare it to other periods of time.
If you have a high number of raw samples you may decide to implement collector or archive compression. If you have a different count of raw samples than another time period for the same point in your process, you should understand why the data is missing or why the extra data was logged.
You can use the ihCount calculation mode to easily count the number of raw samples between the start and end time.
RawByFilterToggle Sampling Mode
The RawByFilterToggle sampling mode is a form of filtered data query. A filtered data query returns data values for a particular time period whereas RawByFilterToggle sampling mode returns the time periods where the condition becomes TRUE or FALSE. The RawByFilterToggle sampling mode returns the Timestamp, Value, and Data Quality for the matching entries. The data values returned will have the same tagname which you queried for.
RawByFilterToggle returns only 0 and 1. The value 1 is returned with a timestamp when the filter condition becomes TRUE, and the value 0 is returned with the timestamp when the filter condition becomes FALSE. You can have multiple pairs of 1 and 0 values if the condition becomes TRUE multiple times between the start and end time. If the condition never became TRUE between the start and end time, you will not get any values.
- Timestamp
-
The RawByFilterToggle sampling mode returns 0 and 1 as values. The value 1 is returned with a timestamp when the filter condition becomes TRUE, and the value 0 is returned with the timestamp when the filter condition becomes FALSE. You can have multiple pairs of 1 and 0 values if the condition becomes TRUE multiple times between the start and end time. If the condition never became TRUE between the start and end time, you will not get any values. You can use a filterexpression to return the time ranges that match the criteria.
The RawByFilterToggle sampling mode can return any timestamp between the start and end time, depending on if and when the condition becomes TRUE or FALSE. The timestamps returned can be queried further using RawByTime, RawByNumber, Interpolated, or any other sampling or calculation mode.
- Value
-
This sampling mode only returns 0 and 1 as values. The value 1 is returned with a timestamp where the filter condition is TRUE and 0 is returned with the timestamp where the filter condition is FALSE.
- Data Quality
-
The RawByFilterToggle considers only Good quality data.
Retrieving Data Using RawByFilterToggle Sampling Mode
The following two examples use this data that is imported into Proficy Historian. This data will be used in the examples for retrieving data with the RawByFilterToggle sampling mode.
[Tags]
Tagname,DataType,HiEngineeringUnits,
LoEngineeringUnits RAMP,SingleInteger,10,0
[Data]
Tagname,TimeStamp,Value,Data Quality
RAMP,25-Feb-2013 07:00:00.000,0,Good,
RAMP,25-Feb-2013 07:00:01.000,1,Good,
RAMP,25-Feb-2013 07:00:02.000,2,Good,
RAMP,25-Feb-2013 07:00:03.000,3,Good,
RAMP,25-Feb-2013 07:00:04.000,4,Good,
RAMP,25-Feb-2013 07:00:05.000,5,Good,
RAMP,25-Feb-2013 07:00:06.000,6,Good,
RAMP,25-Feb-2013 07:00:07.000,7,Good,
RAMP,25-Feb-2013 07:00:08.000,8,Good,
RAMP,25-Feb-2013 07:00:09.000,9,Good,
RAMP,25-Feb-2013 07:00:10.000,10,Good,
RAMP,25-Feb-2013 07:00:11.000,11,Good,
RAMP,25-Feb-2013 07:00:12.000,12,Good,
RAMP,25-Feb-2013 07:00:13.000,13,Good,
RAMP,25-Feb-2013 07:00:14.000,14,Good,
RAMP,25-Feb-2013 07:00:15.000,15,Good,
RAMP,25-Feb-2013 07:00:16.000,16,Good,
RAMP,25-Feb-2013 07:00:17.000,17,Good,
RAMP,25-Feb-2013 07:00:18.000,18,Good,
RAMP,25-Feb-2013 07:00:19.000,19,Good,
RAMP,25-Feb-2013 07:00:20.000,20,Good,
RAMP,25-Feb-2013 07:00:21.000,21,Good,
RAMP,25-Feb-2013 07:00:22.000,22,Good,
RAMP,25-Feb-2013 07:00:23.000,23,Good,
RAMP,25-Feb-2013 07:00:24.000,24,Good,
RAMP,25-Feb-2013 07:00:25.000,25,Good,
RAMP,25-Feb-2013 07:00:26.000,26,Good,
RAMP,25-Feb-2013 07:00:27.000,27,Good,
RAMP,25-Feb-2013 07:00:28.000,28,Good,
RAMP,25-Feb-2013 07:00:29.000,29,Good,
RAMP,25-Feb-2013 07:00:30.000,30,Good,
RAMP,25-Feb-2013 07:00:31.000,31,Good,
RAMP,25-Feb-2013 07:00:32.000,32,Good,
RAMP,25-Feb-2013 07:00:33.000,33,Good,
RAMP,25-Feb-2013 07:00:34.000,34,Good,
RAMP,25-Feb-2013 07:00:35.000,35,Good,
RAMP,25-Feb-2013 07:00:36.000,36,Good,
RAMP,25-Feb-2013 07:00:37.000,37,Good,
RAMP,25-Feb-2013 07:00:38.000,38,Good,
RAMP,25-Feb-2013 07:00:39.000,39,Good,
RAMP,25-Feb-2013 07:00:40.000,40,Good,
RAMP,25-Feb-2013 07:00:41.000,41,Good,
RAMP,25-Feb-2013 07:00:42.000,42,Good,
RAMP,25-Feb-2013 07:00:43.000,43,Good,
RAMP,25-Feb-2013 07:00:44.000,44,Good,
RAMP,25-Feb-2013 07:00:45.000,45,Good,
RAMP,25-Feb-2013 07:00:46.000,46,Good,
RAMP,25-Feb-2013 07:00:47.000,47,Good,
RAMP,25-Feb-2013 07:00:48.000,48,Good,
RAMP,25-Feb-2013 07:00:49.000,49,Good,
RAMP,25-Feb-2013 07:00:50.000,50,Good,
RAMP,25-Feb-2013 07:00:51.000,51,Good,
RAMP,25-Feb-2013 07:00:52.000,52,Good,
RAMP,25-Feb-2013 07:00:53.000,53,Good,
RAMP,25-Feb-2013 07:00:54.000,54,Good,
RAMP,25-Feb-2013 07:00:55.000,55,Good,
RAMP,25-Feb-2013 07:00:56.000,56,Good,
RAMP,25-Feb-2013 07:00:57.000,57,Good,
RAMP,25-Feb-2013 07:00:58.000,58,Good,
RAMP,25-Feb-2013 07:00:59.000,59,Good,
Determining the Time Range After the Condition Became TRUE
An example of a Query using RawByFilterToggle sampling mode is as follows:
starttime=???02/25/2013 07:00:00???, endtime=???02/25/2013 07:10:00???
select timestamp, value, quality from ihrawdata where tagname = RAMP and samplingmode= rawbyfiltertoggle
and filterexpression=???(RAMP>50) and filtermode=AfterTime
This query set would determine when the ramp value exceeded 50 and
returns the time range after that. The following results are obtained:
| Timestamp | Value | Quality |
|---|---|---|
| 02/25/201307:00:00 | 0 | Good NonSpecific |
| 02/25/201307:00:51 | 1 | Good NonSpecific |
| 02/25/201307:10:00 | 1 | Good NonSpecific |
You can see in the raw data that the condition became true at 7:00:51 so the sample is returned with a value of 1. The 0 and 1 are bounding values that would make the data easier to plot. You cannot simply count the number of 1s returned to count the number of times the condition became true. You have to exclude the bounding values
Example 2: Determining the Time Range Before the Condition Became TRUE
An example of a query using RawByFilterToggle sampling mode is as follows
set starttime=???02/25/2013 07:00:00???, endtime=???02/25/2013 08:00:00???
select timestamp, value, quality from ihrawdata where tagname = RAMP and samplingmode= rawbyfiltertoggle
and filterexpression=???(RAMP>10) and filtermode=BeforeTime
The following results are obtained
| Timestamp | Value | Quality |
|---|---|---|
| 02/25/201307:00:00 | 0 | Good NonSpecific |
| 02/25/201307:00:10 | 1 | Good NonSpecific |
| 02/25/201307:00:59 | 0 | Good NonSpecific |
| 02/25/201308:00:00 | 0 | Good NonSpecific |
You can see in the raw data that the condition became true at 7:00:10 so the sample is returned with a value of 1.
Anticipated Usage
This sampling mode can be used for the same reasons as filtered data queries. That is, when you want the Historian Data Archiver to determine the exact time(s) of the event and you have an approximate time range for an event of interest, such as:
- A batch starting or completing.
- A value exceeding a limit.
- A collected value matching a specified value.
Once you have the exact time range(s) as returned from RawByFilterToggle, you can use those time ranges in the subsequent data queries or in custom reporting or data analysis applications.
Trend Sampling Mode
The Trend Sampling mode maximizes performance when retrieving data specifically for plotting.
The Trend Sampling mode identifies significant points and returns them to the caller. These will be raw samples. Significant points are established by finding the raw minimum and raw maximum values within each interval. Note that this is not the same as finding the change in slope direction of a line, as archive compression does.
The Trend Sampling mode approximates a high resolution trend with only as much detail as could be drawn on the page. For example, say you are about to draw a trend on the page and you know that the area with the trend graph is only 100 pixels wide. You could not possibly represent any more than 100 points in those 100 pixels. By using the Trend sampling type, you can ensure you retrieve adjacent highs and lows to draw a visually accurate trend with only 100 points, regardless of whether the time period was one year or one hour.
Since the Trend Sampling mode does not need to acquire all data between the specified start and end times, it is a very efficient method of data retrieval, especially for large data sets. Depending on the requested start and end times (and the amount of data stored for that interval), it could be as much as 100 times faster than other methods.
When displaying data for reports or examination, this principle can be applied to other sampling types too. It is highly inefficient to trend data at a higher resolution than can be drawn on page or printed on hard copy. This is useful even for calculation modes like "Average value". It is not suitable for Interpolated mode, since this results in a loss of detail that ihTrend sampling attempts to recapture.
The ihTrend sampling type returns adjacent highs and lows within each interval. If you ask for 100 samples, you will effectively receive 50 high values and 50 low values over 100 intervals. The retrieval process works as follows:
- Divide the query duration into even-length intervals, like other sampling modes.
- Determine the raw minimum and raw maximum for each interval. If there is only one point, then that is both the minimum and maximum.
- Since we want to return 2 samples per interval (a minimum and a maximum), we need twice as many intervals. Divide each interval in half. For example, a one hour interval of 01:00:00 to 02:00:00 becomes 2 intervals (01:00:00 to 01:30:00) and (01:30:00 to 02:00:00) .
- Put the minimum in one half-interval and the maximum in the other. If minimum comes before maximum, put the minimum in the first half-interval and the maximum in second half-interval, and vice versa.
When doing filtered data queries, your maximum returned intervals must pass the throttle, even if only a few intervals actually match the filtered criteria.
- Timestamp
-
There is no difference between full-interval timestamps and half-interval timestamps. Both are valid and all interval timestamps are in ascending order.
The Trend Sampling mode will always have an even number of samples, rounded up when necessary.
For example, if you request num samples = 7 or num samples = 8, you will get 8 samples.
If you request results by interval instead of number of samples, you will get back twice the number of results you expect.
For example, a 5-minute interval for a 40-minute duration is normally 40 / 5 = 8 samples. But with trend sampling, you get 16 evenly-spaced intervals.
- Value
- The raw minimum or raw maximum of the full interval. There is no indication as to which one you are getting.
- Data Quality
-
Trend sampling uses the same logic as interpolated sampling to determine the percent good quality.
Retrieving trend sample value
Using the data from the interpolated example, execute this query
select timestamp, value, quality from ihrawdata where samplingmode=trend and timestamp >=
'29-Mar-2002 13:50' and timestamp <= '29-Mar-2002 14:30' and tagname  = tag1 and numberofsamples = 8
The following results are returned:
| Timestamp | Value | Quality | Raw Samples |
|---|---|---|---|
| 29-Mar-200213:55:00.000 | 22.70 | 100.00 | None |
| 29-Mar-200214:00:00.000 | 22.70 | 100.00 | 13:59:00.000,22.7, Good |
| 29-Mar-200214:05:00.000 | 12.50 | 100.00 | None |
| 29-Mar-200214:10:00.000 | 12.50 | 100.00 | 14:08:00.000,12.5, Good |
| 29-Mar-200214:15:00.000 | 7.00 | 100.00 | 14:14:00.000,7.0, Good |
| 29-Mar-200214:20:00.000 | 7.00 | 100.00 |
The interval timestamps are the same as for interpolated. The raw minimum and raw maximum are determined for each interval.
For example, a tag has data every second for 1 year (around 31 million data points).
We want to perform a query using ihTrend with
StartTime = LastYear, EndTime
= now, and NumSamples = 364.
The StartTime to EndTime is broken down into
NumSamples/2 pseudo-intervals (182). For each pseudointerval,
the min and max value is found. These will be the first two data points. With two
data points per pseudo-interval multiplied by NumSamples/2 gives us
the desired NumSamples. If the minimum occurs before the maximum,
it will be the first of the two samples, and vice versa.
The query:
select timestamp, value, quality from ihrawdata where samplingmode=lab and timestamp >=
 '29-Mar-2002 13:50' and timestamp <= '29-Mar-2002 14:30' and tagname  = tag1 and numberofsamples = 8
The following results are returned:
| Timestamp | Value | Quality |
|---|---|---|
| 29-Mar-200213:55:00.000 | 0.00 | 0.00 |
| 29-Mar-200214:00:00.000 | 22.70 | 100.00 |
| 29-Mar-200214:05:00.000 | 22.70 | 100.00 |
| 29-Mar-200214:10:00.000 | 12.50 | 100.00 |
| 29-Mar-200214:15:00.000 | 7.00 | 100.00 |
| 29-Mar-200214:20:00.000 | 7.00 | 100.00 |
| 29-Mar-200214:25:00.000 | 4.80 | 100.00 |
| 29-Mar-200214:30:00.000 | 4.80 | 100.00 |
Trend Data returned in the wrong interval
Note that, with trend sampling, data can be returned using an interval timestamp that does not contain the sample. A CSV file includes three values for each of 9 days.
[Data]
Tagname,TimeStamp,Value
Dfloattag5,01/05/03 8:00,95.00
Dfloattag5,01/05/03 15:00,88.00
Dfloattag5,01/05/03 16:00,80.00
Dfloattag5,01/06/03 7:00,11.00
Dfloattag5,01/06/03 10:00,13.00
Dfloattag5,01/06/03 13:00,93.00
Dfloattag5,01/07/03 8:00,99.0
Dfloattag5,01/07/03 11:00,86.0
Dfloattag5,01/07/03 12:00,16.0
Dfloattag5,01/08/03 8:00,0.00
Dfloattag5,01/08/03 12:00,99.00
Dfloattag5,01/08/03 14:00,100.00
If you use the following query:
Select timestamp,tagname,value Quality from ihrawdata where tagname =dfloattag5
And samplingmode= trend and intervalmilliseconds =24h
And timestamp> ???1/02/2003 07:00:00 and timestamp<= ???01/10/2003 12:00:00???
then the results include:
| Timestamp | Tag Name | Value | Quality |
|---|---|---|---|
| 6-Jan-200319:00:00 | Dfloattag5 | 13.00 | 100 |
| 7-Jan-200307:00:00 | Dfloattag5 | 93.00 | 100 |
| 7-Jan-200319:00:00 | Dfloattag5 | 99.00 | 100 |
| 8-Jan-200307:00:00 | Dfloattag5 | 16.00 | 100 |
It is expected that the value 93 is listed for 1/6/03 19:00:00, since that is where the timestamp of the raw sample occurs. However, the maximum of 1/6/03 07:00:00 to 1/7/03 07:00:00 is:
Dfloattag5,01/06/03 13:00,93.00which comes after the minimum of:
Dfloattag5,01/06/03 10:00,13.00Hence, it is placed in the second half-interval, even though its timestamp does not fall into the time range for that half-interval. Raw samples will never be placed in the wrong "real" interval, but may be placed in the wrong "fake" interval.
Anticipated Usage: Trend sampling is designed only for graphical plotting applications.
Trend2 Sampling Mode
The Trend2 sampling mode is a modified version of the Trend sampling mode.
The Trend2 sampling mode splits up a given time period into a number of intervals (using either a specified number of samples or specified interval length), and returns the minimum and maximum data values that occur within the range of each interval, together with the timestamps of the raw values.
The key differences between Trend and Trend2 sampling modes are in:
- How they treat a sampling period that does not evenly divide by the interval length:
- For the Trend sampling mode, Historian ignores any leftover values at the end, rather than putting them into a smaller interval.
- For the Trend2 sampling mode, Historian creates as many intervals of the interval length as will fit into the sampling period, and then creates a remainder interval from whatever time is left.
- Spacing of timestamps returned:
- For the Trend sampling mode, Historian returns evenly-spaced interval timestamps.
- For the Trend2 sampling mode, Historian returns raw sample timestamps. These timestamps can be unevenly spaced, since raw data can be unevenly spaced.
- Inclusion of start and end times entered:
- The Trend sampling mode is start time exclusive and end time inclusive.
- The Trend2 sampling mode is start time inclusive and end time inclusive.
The Trend sampling mode is more suitable for plotting applications that prefer evenly-spaced data.
The Trend2 sampling mode is more suitable for analysis of mins and maxes and for plotting programs that can handle unevenly spaced data.
| Name | Description |
|---|---|
| Tagname(s) | Specify all of the tag(s) on which to perform Trend2 sampling. |
| Starting time |
Specify when the time period starts. Values in the raw data whose timestamps fall on the starting time will be included in the results, if they are the minimum or the maximum in the interval. |
| Ending time |
Specify when the time period ends. Values in the raw data whose timestamps fall on the ending time will be included in the results, if they are the minimum or the maximum in the interval. |
| Name | Description |
|---|---|
| Interval length | If you specify the interval length, then Historian splits
the time period between start and end into as many intervals of that
length as will fit in the period. For example, if you have a 30 second time period, and you request intervals of 5 seconds, Historian will break the time period into 6 intervals, each of which covers 5 seconds. If the sampling period does not evenly divide by the interval length, then Historian creates as many intervals of that length as will fit, and then create a remainder interval from whatever time is left. So, if we request intervals of 7 seconds for a 30 second time period, Historian splits the sampling period into 4 intervals of 7 seconds each, and one remainder interval of 2 seconds. This behavior is in contrast to the original Trend sampling, which would simply ignore any leftover values at the end, rather than putting them into a smaller interval. |
| Number of samples | If you specify the number of samples to return, Historian
determines the number of intervals to return. Each interval returns
2 samples, so Historian divides the time period between start
and end into half as many intervals as there are specified samples.
For example, if you specify 12 samples, Historian will divide the time period into 6 intervals, because 12/2 = 6. If the number of samples specified is odd, then it is rounded up to the nearest even number. So, if you ask for 7 samples, Historian rounds up to 8 samples, from 8/2 = 4 intervals. All intervals are of the same length. If the time period from start to finish is 60 seconds and we request 10 intervals, then each interval will be 6 seconds long. |
Hybrid Modes
Hybrid mode is an advanced method of sampling collected data for trending. This mode of sampling has the ability to switch between sampled (like interpolated or trend) and raw data based on the actual and requested number of samples or a specified time interval. The purpose of these modes is to return the minimum number of points to speed and simplify trending .
Hybrid mode is available for Interpolated, Lab, Trend, and Trend2 modes of sampling.
In these hybrid modes, the behavior is as follows
- If the actual number of stored samples is fewer than requested you will receive the raw data samples.
- If the actual number of stored samples is fewer than requested you will receive the raw data samples.
Data for Examples
[Tags]
Tagname,DataType
TagA,DoubleInteger
[Data]
Tagname,Timestamp,Value,Quality
TagA,01/06/2014 12:00:01 PM,40000000,Good
TagA,01/06/2014 12:00:02 PM,30696808,Good
TagA,01/06/2014 12:00:03 PM,1952308224,Good
TagA,01/06/2014 12:00:04 PM,672641664,Good
TagA,01/06/2014 12:00:05 PM,636126336,Good
TagA,01/06/2014 12:00:06 PM,1826624640,Good
TagA,01/06/2014 12:00:07 PM,838753408,Good
TagA,01/06/2014 12:00:08 PM,520660896,Good
TagA,01/06/2014 12:00:09 PM,1293350272,Good
TagA,01/06/2014 12:00:10 PM,1959451264,Good
TagA,01/06/2014 12:00:11 PM,89220576,Good
TagA,01/06/2014 12:00:12 PM,1951745280,Good
TagA,01/06/2014 12:00:13 PM,888276160,Good
TagA,01/06/2014 12:00:14 PM,1031795200,Good
TagA,01/06/2014 12:00:15 PM,1449288960,Good
TagA,01/06/2014 12:00:16 PM,1516603392,Good
TagA,01/06/2014 12:00:17 PM,1843676544,Good
TagA,01/06/2014 12:00:18 PM,1672796672,Good
TagA,01/06/2014 12:00:19 PM,1533833984,Good
TagA,01/06/2014 12:00:20 PM,1697586560,Good
TagA,01/06/2014 12:00:21 PM,1647121280,Good
TagA,01/06/2014 12:00:22 PM,543921472,Good
TagA,01/06/2014 12:00:23 PM,1141920768,Good
TagA,01/06/2014 12:00:24 PM,540008448,Good
TagA,01/06/2014 12:00:25 PM,731087232,Good
TagA,01/06/2014 12:00:26 PM,631079296,Good
TagA,01/06/2014 12:00:27 PM,1160291968,Good
TagA,01/06/2014 12:00:28 PM,1324413696,Good
TagA,01/06/2014 12:00:29 PM,1875167744,Good
TagA,01/06/2014 12:00:30 PM,390197280,Good
TagA,01/06/2014 12:00:31 PM,192162736,Good
TagA,01/06/2014 12:00:32 PM,646106624,Good
TagA,01/06/2014 12:00:33 PM,210439200,Good
TagA,01/06/2014 12:00:34 PM,675144064,Good
TagA,01/06/2014 12:00:35 PM,1421636224,Good
TagA,01/06/2014 12:00:36 PM,537191872,Good
TagA,01/06/2014 12:00:37 PM,492214752,Good
TagA,01/06/2014 12:00:38 PM,1376227840,Good
TagA,01/06/2014 12:00:39 PM,1085046656,Good
TagA,01/06/2014 12:00:40 PM,924105984,Good
TagA,01/06/2014 12:00:41 PM,1294991488,Good
TagA,01/06/2014 12:00:42 PM,1737416960,Good
TagA,01/06/2014 12:00:43 PM,582910848,Good
TagA,01/06/2014 12:00:44 PM,1745973760,Good
TagA,01/06/2014 12:00:45 PM,1607484928,Good
TagA,01/06/2014 12:00:46 PM,2005492352,Good
TagA,01/06/2014 12:00:47 PM,746677184,Good
TagA,01/06/2014 12:00:48 PM,2143539456,Good
TagA,01/06/2014 12:00:49 PM,2009761664,Good
TagA,01/06/2014 12:00:50 PM,640139968,Good
TagA,01/06/2014 12:00:51 PM,990464704,Good
TagA,01/06/2014 12:00:52 PM,109999792,Good
TagA,01/06/2014 12:00:53 PM,1269805568,Good
TagA,01/06/2014 12:00:54 PM,1111627520,Good
TagA,01/06/2014 12:00:55 PM,60175184,Good
TagA,01/06/2014 12:00:56 PM,1407366400,Good
TagA,01/06/2014 12:00:57 PM,928761280,Good
TagA,01/06/2014 12:00:58 PM,1666397696,Good
TagA,01/06/2014 12:00:59 PM,438304832,Good
TagA,01/06/2014 12:01:00 PM,1179844864,Good
TagA,01/07/2014 06:00:01 PM,9000,Good
TagA,01/07/2014 06:00:02 PM,5,Good
TagA,01/07/2014 06:00:03 PM,8,Good
TagA,01/07/2014 06:00:04 PM,-1,Good
TagA,01/07/2014 06:00:05 PM,4,Good
TagA,01/07/2014 06:00:06 PM,485,Good
TagA,01/07/2014 06:00:07 PM,-30000,Good
TagA,01/07/2014 06:00:08 PM,2,Good
TagA,01/07/2014 06:00:09 PM,4,Good
TagA,01/07/2014 06:00:10 PM,-60000,Good
TagA,01/07/2014 06:00:11 PM,60000,Good
TagA,01/07/2014 06:00:12 PM,1,Good
TagA,01/07/2014 06:00:13 PM,1,Good
TagA,01/07/2014 06:00:14 PM,30,Good
TagA,01/07/2014 06:00:15 PM,-70000,Good
TagA,01/07/2014 06:00:16 PM,-70000,Good
TagA,01/07/2014 06:00:17 PM,5,Good
TagA,01/07/2014 06:00:18 PM,1,Good
TagA,01/07/2014 06:00:19 PM,8,Good
TagA,01/07/2014 06:00:20 PM,220,Good
TagA,01/07/2014 06:00:21 PM,45,Good
TagA,01/07/2014 06:00:22 PM,44,Good
TagA,01/07/2014 06:00:23 PM,12,Good
TagA,01/07/2014 06:00:24 PM,13,Good
TagA,01/07/2014 06:00:25 PM,-5600,Good
TagA,01/07/2014 06:00:26 PM,15,Good
TagA,01/07/2014 06:00:27 PM,0,Good
TagA,01/07/2014 06:00:28 PM,25000,Good
TagA,01/08/2014 09:00:01 AM,1400,Good
TagA,01/08/2014 09:00:02 AM,0,Good
TagA,01/08/2014 09:00:03 AM,16,Good
TagA,01/08/2014 09:00:04 AM,-1400,Good
TagA,01/08/2014 09:00:05 AM,-12,Good
TagA,01/08/2014 09:00:06 AM,125,Good
TagA,01/08/2014 09:00:07 AM,150,Good
TagA,01/08/2014 09:00:08 AM,13,Good
TagA,01/08/2014 09:00:09 AM,-56,Good
TagA,01/08/2014 09:00:10 AM,12,Good
TagA,01/08/2014 09:00:11 AM,45,Good
This following examples provide various cases of the InterpolatedtoRaw hybrid mode illustrating the switching of data between raw and calculated data.
Tag1 5/16/2011 15:52:24 1,000.0000000 100.0000000
Tag1 5/16/2011 15:52:25 1,001.0000000 100.0000000
Tag1 5/16/2011 15:52:26 1,002.0000000 100.0000000
Tag1 5/16/2011 15:52:27 1,003.0000000 100.0000000
Tag1 5/16/2011 15:52:28 1,004.0000000 100.0000000
Tag1 5/16/2011 15:52:29 1,005.0000000 100.0000000
Tag1 5/16/2011 15:52:30 1,006.0000000 100.0000000
Case 1
Use the following query to retrieve data for Tag 1 where it requests for 5 samples using InterpolatedtoRaw mode.
SET starttime= '5/16/2011 15:52:05 PM', endtime= '5/16/2011 15:52:47 PM', numberofsamples = 5, samplingmode= Interpolatedtoraw SELECT * FROM ihrawdata where tagname = "TAG1"The query will return interpolated data as shown below because the actual number of raw samples (7) is greater than the requested number of samples (5):
| tagname | timesstamp | value | quality | samplingmode | numberofsamples |
|---|---|---|---|---|---|
| Tag1 | 5/16/2011 15:52:13 | 0.0000000 | 0.0000000 | InterpolatedtoRaw | 5 |
| Tag1 | 5/16/2011 15:52:21 | 0.0000000 | 0.0000000 | InterpolatedtoRaw | 5 |
| Tag1 | 5/16/2011 15:52:30 | 1,006.0000000 | 100.0000000 | InterpolatedtoRaw | 5 |
| Tag1 | 5/16/2011 15:52:38 | 1,006.0000000 | 100.0000000 | InterpolatedtoRaw | 5 |
| Tag1 | 5/16/2011 15:52:47 | 1,006.0000000 | 100.0000000 | InterpolatedtoRaw | 5 |
Case 2
Use the following query to retrieve data for Tag 1 where it requests for 50 samples using InterpolatedtoRaw mode.
starttime= '5/16/2011 3:52:05 PM', endtime= '5/16/2011 3:52:47 PM', numberofsamples = 50, sampling- mode= Interpolatedtoraw SELECT & FROM ihrawdata where tagname = "TAG1"The query will return raw data as shown below because the actual sample count(7) is less than the requested sample count (50):
| tagname | timesstamp | value | quality | samplingmode | numberofsamples |
|---|---|---|---|---|---|
| Tag1 | 5/16/2011 15:52:24 | 1,000.0000000 | 100.0000000 | InterpolatedtoRaw | 50 |
| Tag1 | 5/16/2011 15:52:25 | 1,001.0000000 | 100.0000000 | InterpolatedtoRaw | 50 |
| Tag1 | 5/16/2011 15:52:26 | 1,002.0000000 | 100.0000000 | InterpolatedtoRaw | 50 |
| Tag1 | 5/16/2011 15:52:27 | 1,003.0000000 | 100.0000000 | InterpolatedtoRaw | 50 |
| Tag1 | 5/16/2011 15:52:28 | 1,004.0000000 | 100.0000000 | InterpolatedtoRaw | 50 |
| Tag1 | 5/16/2011 15:52:29 | 1,005.0000000 | 100.0000000 | InterpolatedtoRaw | 50 |
| Tag1 | 5/16/2011 15:52:30 | 1,006.0000000 | 100.0000000 | InterpolatedtoRaw | 50 |
Case 3
Use the following query to retrieve data for Tag 1 where it requests for samples in a time interval (milliseconds), using InterpolatedtoRaw mode.
SET starttime= '5/16/2011 3:52:05 PM', endtime= '5/16/2011 3:52:25 PM', intervalmilliseconds=10s , samplingmode= Interpolatedtoraw
Tag1 5/16/2011 15:52:24 1,000.0000000 100.0000000
Tag1 5/16/2011 15:52:25 1,001.0000000 100.0000000
The query will return interpolated data as shown below because the actual number of raw samples (7) is greater than the requested number of samples (5):
| Tagname | Timestamp | Value | Quality | Sampling MOde |
|---|---|---|---|---|
| Tag1 | 5/16/2011 15:52:24 | 1,000.0000000 | 1,000.0000000 | InterpolatedtoRaw |
| Tag1 | 5/16/2011 15:52:25 | 1,001.0000000 | 1,000.0000000 | InterpolatedtoRaw |
Calculation Modes
This information is intended to supplement the information in the Historian product documentation and the SDK Help File.
Sampling and calculation modes are used on retrieval of data that has already been collected to the archive. Calculation modes are used when the sampling mode is set to "Calculated". It is helpful to separate the many modes into 3 main categories from simplest to most complex. A detailed explanation of the calculation modes with examples are discussed in following topics:
- Count
- RawTotal
- RawAverage
- RawStandardDeviation
- FirstRawValue
- FirstRawTime
- LastRawValue
- LastRawTime
- Minimum
- MinimumTime
- Maximum
- MaximumTime
- TimeGood
- Average
- Total
- StandardDeviation
Other Calculation Modes
- STATECOUNT
- STATETIME
- OPCQOR and OPCQAND
- TagStats
Each sample retrieved from Historian has a timestamp, value, and quality.
- Timestamp - the same logic as for interpolated values. It is covered in detail in the Understanding Sampling Modes document and not covered at all in this document.
- Value depends entirely on the calculation mode being used
- Quality - Depending on the calculation mode, this either means:
- The percent of raw samples vs. total raw samples in the interval that were of good data quality.
- The percent of time in the interval that the data was of good data quality
Filtered data queries are described in the Filtered data Queries section.
Raw Calculation Modes
The calculation modes use only collected raw samples to determine the value for each interval.
- Value: The count of raw samples with good quality in the interval. The values of the each sample are ignored. The Count does not include any samples with bad quality, including the start and end of collection markers.
- Quality: Percent good is always 100, even if the interval does not contain any raw samples or contains only bad quality samples.
- Anticipated Usage: Count is useful for analyzing the distribution of the raw data samples to determine the effect of compression deadbands. It is also useful to determine which tags are consuming the most archive space.
- Value: The sum of the good quality values of all raw samples in the interval. All bad quality samples are ignored.
- Quality: Percent good is always 100, even if the interval does not contain any raw samples or it contains only bad quality samples.
- Anticipated Usage: RawTotal mode is useful for calculating an accurate total when a sufficient number of raw samples are collected. Note that unlike ihTotal, this is a simple sum with no assumption that the values are rate values.
- Value: The sum of all good quality samples in the interval, divided by the number of good quality samples in the interval. All bad quality samples are ignored. That is, RawAverage is equivalent to the RawTotal divided by Count.
- Quality: If there are no raw samples in the interval or they all have bad
quality, then the percent good is 0. Otherwise, percent good is always 100,
even if the interval contains bad quality
samples.
select timestamp, value, quality from ihrawdata where samplingmode=calculated and calculationmode=rawaverage and timestamp >= '29-Mar-2002 13:30' and timestamp <= '29-Mar-2002 14:30' and tagname = counttag and intervalmilliseconds = 10M - Anticipated Usage: The RawAverage mode is useful for calculating an accurate average when a sufficient number of raw samples are collected.
- Value:
- Quality:
- Anticipated Usage:
RawStandardDeviation Mode: Retrieves the arithmetic standard deviation of raw values for each calculation interval.
- Value: Any raw point of bad data quality is ignored.
- Quality: If there are no raw samples in the interval or they all have bad quality, then the percent good is 0. Otherwise, percent good is always 100, even if the interval contains bad quality samples.
- Anticipated Usage: The RawStandardDeviation mode is useful for calculating an accurate standard deviation when a sufficient number of raw samples are collected.
- Value: The value of the raw sample or zero if there are no good raw samples in the interval. The timestamp of the sample or the year 1969 if there are no good raw samples in the interval.
- Quality: The quality is the same for FirstRawValue and First RawTime. If
there are no good raw samples in the interval, then the percent good is 0.
Otherwise, the percent good is always 100, even if the interval contains bad
quality samples.
The Raw sample has a quality of Good, Bad or Uncertain, and that is converted to a 0 or 100 percent.
- Anticipated Usage:
- Value: The value of the raw sample or zero if there are no good raw samples in the interval. The timestamp of the sample or the year 1969 if there are no good raw samples in the interval.
- Quality:
The quality is the same for LastRawValue and LastRawTime. If there are no good raw samples in the interval, then the percent good is 0. Otherwise, percent good is always 100, even if the interval contains bad quality samples.
The Raw sample has a quality of Good, Bad or Uncertain, and that is converted to a 0 or 100 percent.
- Anticipated Usage:
Calculating the count of raw samples
The following example demonstrates that only good samples are counted. Importing the following data ensures that at least one interval has 0 samples.
[Tags]
Tagname,DataType,HiEngineeringUnits,LoEngineeringUnits
COUNTTAG,SingleInteger,100,0
[Data]
Tagname,TimeStamp,Value,DataQuality
COUNTTAG,29-Mar-2002 13:59:00.000,22,Good
COUNTTAG,29-Mar-2002 14:08:00.000,12,Bad
COUNTTAG,29-Mar-2002 14:22:00.000,4,Good
The following query retrieves data with a start time of 14:00 and an end time of 14:30 with a 10-minute interval.
select timestamp, value, quality from ihrawdata where samplingmode=calculated and calculationmode=count and timestamp >='29-Mar-2002 14:00' and timestamp <= '29-Mar-2002 14:30' and tagname = counttag and intervalmilliseconds = 10M| Time Stamp | Value | Quality |
|---|---|---|
| 29-Mar-200214:10:00.000 | 0.00 | 100.00 |
| 29-Mar-200214:20:00.000 | 0.00 | 100.00 |
| 29-Mar-200214:30:00.000 | 1.00 | 100.00 |
Calculating the Raw Total
The following example demonstrates that only good quality samples are included in the sum. Perform the fol- lowing query on the same data set as that in the Count example above:
select timestamp, value, quality from ihrawdata where samplingmode=calculated and calculationmode=rawtotal and timestamp >= '29-Mar-2002 13:30' and timestamp <= '29-Mar-2002 14:30' and tagname = counttag and intervalmilliseconds = 10M | Time Stamp | Value | Quality |
|---|---|---|
| 29-Mar-200213:40:00.000 | 0.00 | 100.00 |
| 29-Mar-200213:50:00.000 | 0.00 | 100.00 |
| 29-Mar-200214:00:00.00 | 22.00 | 100.00 |
| 29-Mar-200214:10:00.000 | 0.00 | 100.00 |
| 29-Mar-200214:20:00.000 | 0.00 | 100.00 |
| 29-Mar-200214:30:00.000 | 4.00 | 100.00 |
If the same start and end time are used, but the time span is treated as a single interval, then all values are added together:
select timestamp, value, quality from ihrawdata where samplingmode=calculated and calculationmode=rawtotal and timestamp >= '29-Mar-2002 13:30' and timestamp <= '29-Mar-2002 14:30' and tagname = counttag
and numberofsamples=1| Time Stamp | Value | Quality |
|---|---|---|
| 29-Mar-200214:30:00.000 | 26.00 | 100.00 |
Even though the time span covers all raw samples, only the two good quality samples are used in the calculation: 26 = 22 + 4
Calculating RawAverage
select timestamp, value, quality from ihrawdata where samplingmode=calculated and calculationmode=rawaverage and
timestamp >= '29-Mar-2002 13:30' and timestamp <= '29-Mar-2002 14:30' and tagname = counttag and intervalmilliseconds = 10M| Time Stamp | Value | Quality |
|---|---|---|
| 29-Mar-200213:40:00.000 | 0.00 | 0.00 |
| 29-Mar-200213:50:00.000 | 0.00 | 0.00 |
| 29-Mar-200214:00:00.000 | 22.00 | 100.00 |
| 29-Mar-200214:10:00.000 | 0.00 | 0.00 |
| 29-Mar-200214:30:00.000 | 4.00 | 100.00 |
The interval from 14:11 to 14:20 has no raw samples. The percent good quality of 0.
The interval from 14:01 to 14:10 has 0 good and 1 bad samples. It also has a percent good quality of 0.
The interval from 14:21 to 14:30 has 1 good and 0 bad samples. It has a percent good quality of 100.
If the same start and end time are used, but the time span is treated as a single interval, then all values are averaged together:
select timestamp, value, quality from ihrawdata where samplingmode=calculated and calculationmode=rawaverage
and timestamp >= '29-Mar-2002 13:30' and timestamp <= '29-Mar-2002 14:30' and tagname = counttag and
numberofsamples=1| Time Stamp | Value | Quality |
|---|---|---|
| 29-Mar-200214:30:00.000 | 13.00 | 100.00 |
Even though the time span covers all raw samples, but only the two good samples are used in the calculation: 13 = (22+4)/2 Since the interval includes at least one good quality sample, percent good for the interval is 100, even though 33% of the samples are of bad quality.
Calculating the Raw Standard Deviation
The following example demonstrates that only good samples are included in the standard deviation. Perform the following query on the same data set as that in the Count example above:
select timestamp, value, quality from ihrawdata where samplingmode=calculated and calculationmode=rawstandarddeviation and
timestamp >= '29-Mar-2002 13:30' and timestamp <= '29-Mar-2002 14:30' and tagname = counttag and numberofsamples=1| Time Stamp | Value | Quality |
|---|---|---|
| 29-Mar-200214:30:00.000 | 12.73 | 100.00 |
Retrieving the FirstRawValue/FirstRawTime Values
Import this data to Historian:
[Tags]
Tagname,DataType,HiEngineeringUnits,LoEngineeringUnits
Tag1,SingleFloat,60,0
[Data]
Tagname,TimeStamp,Value,DataQuality
Tag1,07-05-2011 17:24:00,29.72,Bad
Tag1,07-05-2011 17:25:00,29.6,Good
Tag1,07-05-2011 17:26:00,29.55,Good
Tag1,07-05-2011 17:27:00,29.49,Bad
Tag1,07-05-2011 17:28:00,29.53,Bad
Tag1,07-05-2011 17:29:00,29.58,Good
Tag1,07-05-2011 17:30:00,29.61,Bad
Tag1,07-05-2011 17:31:00,29.63,Bad
Tag1,07-05-2011 18:19:00,30,Good
Tag1,07-05-2011 18:20:00,29.96,Good
Tag1,07-05-2011 18:21:00,29.89,Good
Tag1,07-05-2011 18:22:00,29.84,Good
Tag1,07-05-2011 18:23:00,29.81,Bad
Using FirstRawValue Calculation Mode
set starttime='07-05-2011 16:00:00', endtime='07-05-2011 19:00:00'
select timestamp,value,quality from ihrawdata where tagname like 'Tag1' and samplingMode=Calculated and
CalculationMode=FirstRawValue and intervalmilliseconds=1h
The output is as follows:
| Time Stamp | Value | Quality |
|---|---|---|
| 07-05-201117:00:00 | 0.0000000 | 0.0000000 |
| 07-05-201118:00:00 | 29.6000000 | 100.0000000 |
| 07-05-201119:00:00 | 30.0 | 100.0000000 |
For the time interval 16:00 to 17:00 there are no raw values so a value and quality of 0 is returned for both FirstRawValue and FirstRawTime. The first raw sample from17:00 to 18:00 is 29.72 but it is a bad data quality so it is skipped and the 29.6 is returned and its timestamp of 17:25 is returned in FirstRawTime. FirstRawValue calculation mode considers only good quality data. In the last interval the first good raw sample is 30 and is returned and its timestamp is returned as FirstRawTime.
Retrieving the LastRawValue/LastRawTime Values
Import this data into Historian
[Tags]Tagname,DataType
DecimatedOneHour,DoubleInteger
[Data]
Tagname,Timestamp,Value,DataQuality
Tag1,07-05-2011 17:29:00,29,Good
Tag1,07-05-2011 20:00:00,0,Good
Tag1,07-05-2011 20:12:00,12,Good
Tag1,07-05-2011 20:15:00,0,Bad
Using LastRawValue Calculation Mode
set starttime='07-05-2011 17:00:00',endtime=' 07-05-2011 21:00:00'
select timestamp,value,quality from ihrawdata where tagname like Tag1 and samplingmode=Calculated and
CalculationMode=LastRawValue and Intervalmilliseconds=1h
The output is as follows:
| Time Stamp | Value | Quality |
|---|---|---|
| 07-05-201118:00:00 | 29 | 100.0000000 |
| 07-05-201119:00:00 | 0 | 0.0000000 |
| 07-05-201120:00:00 | 0 | 100.0000000 |
| 07-05-201121:00:00 | 12 | 100.0000000 |
In the interval from 17:00 to 18:00 the last good value is 29. The 18:00 to 19:00 has no raw samples so the quality is bad. The 20:00 sample is returned as the last good value in the 19:00 to 20:00. In the final interval, the last raw sample is bad quality so it is ignored and the previous sample is returned.
Using LastRawTime Calculation Mode
set starttime='07-05-2011 17:00:00',endtime=' 07-05-2011 21:00:00'
select timestamp,value,quality from ihrawdata where tagname like Tag1 and samplingmode=Calculated and CalculationMode=
LastRawTime and Intervalmilliseconds=1h
The output is as follows:
| Time Stamp | Value | Quality |
|---|---|---|
| 07-05-201117:00:00 | 07-05-201117:29:00 | 100.0000000 |
| 07-05-201118:00:00 | 01-01-197005:30:00 | 0.0000000 |
| 07-05-201119:00:00 | 07-05-201120:00:00 | 100.0000000 |
| 07-05-201120:00:00 | 07-05-201120:12:00 | 100.0000000 |
Interpolated Calculation Modes
Interpolation is used in many calculation modes. When using interpolated data, it is possible that there are no raw samples in the interval (such as with highly-compressed data) so the archiver requires additional samples to perform calculations.
The Minimum, MinimumTime, Maximum, and MaximumTime all use interpolation to arrive at two additional samples per interval. One is interpolated at the interval start time and one is interpolated at the interval end time. The interpolated samples are used in calculations just like raw, collected samples within the interval. In particular, the minimum or maximum calculated value can be a raw or interpolated value.
All described rules for interpolating a value at an interval's end time also apply to the interval's start time. There is no raw maximum or raw minimum sampling mode. To acquire these values, you must retrieve the raw samples using RawByTime or RawByNumber and compute the minimum or maximum yourself.
Similarly, you must also manually calculate a minimum or maximum when using values acquired through lab sampling.
- Value:
Maximum returns the raw or interpolated value with the greatest value and good data quality in the interval. Minimum returns the raw or interpolated value with the lowest value and good data quality in the interval
MaximumTime returns the time stamp of the Maximum value. MinimumTime returns the time stamp of the Minimum value.
In all cases, all raw samples of bad quality is ignored, both during interpolation and when calculating the maximum.
- Quality: If the raw samples in the interval all have bad quality, or if the sample before the interval has bad quality, then percent good is 0. Otherwise, percent good is always 100, even if the interval does not contain any raw samples or contains both good and bad quality samples.
TimeGood Mode: The TimeGood mode calculates the amount of time for which the data was of good quality.
The TimeGood mode is most useful when combined with filtered data queries. You can use a filter condition to acquire samples for which a specific condition was true, then calculate for how long that data was of a good quality. For example, you could use a filter condition to determine the amount of time a pump was activated, then calculate for how much of that time the data was of a good quality.
To get the most use out of the TimeGood mode, you should understand how filtered data queries work.
- Value: The TimeGood mode retrieves the total number of milliseconds during the interval for which the data is good AND for which the filter condition is true. If there is no filter tag or condition, then TimeGood is the total number of milliseconds in the interval that the data is good.
- Quality: The TimeGood mode always has a percent good of 100, even if there are no raw samples or if all samples have bad quality. In the latter case, the Value will be 0, but the percent good is still 100.
Finding minimum and maximum of Downward Sloping Data
The following example demonstrates how a raw sample is interpolated at the interval's start and end time and how this interpolation is used with raw samples when calculating minimum and maximum values.
[Tags]
Tagname,DataType,HiEngineeringUnits,LoEngineeringUnits
DOWNSLOPE,SingleFloat,100,0
[Data]
Tagname,TimeStamp,Value,DataQuality
DOWNSLOPE,29-Mar-2002 13:59:00.000,22,Good
DOWNSLOPE,29-Mar-2002 14:08:00.000,12,Good
DOWNSLOPE,29-Mar-2002 14:22:00.000,4,Goodselect timestamp, value, quality from ihrawdata where samplingmode=calculated
and calculationmode=Maximum and timestamp >= '29-Mar-2002 13:50' and
timestamp <= '29-Mar-2002 14:30' and tagname = DOWNSLOPE and numberofsamples = 8select timestamp, value, quality from ihrawdata where samplingmode=calculated
and calculationmode=MaximumTime and timestamp >= '29-Mar-2002 13:50' and
timestamp <= '29-Mar-2002 14:30' and tagname = DOWNSLOPE and numberofsamples = 8select timestamp, value, quality from ihrawdata where samplingmode=calculated
and calculationmode=Minimum and timestamp >= '29-Mar-2002 13:50' and
timestamp <= '29-Mar-2002 14:30' and tagname = DOWNSLOPE and numberofsamples = 8select timestamp, value, quality from ihrawdata where samplingmode=calculated
and calculationmode=MinimumTime and timestamp >= '29-Mar-2002 13:50' and
timestamp <= '29-Mar-2002 14:30' and tagname = DOWNSLOPE and numberofsamples = 8select timestamp, value, quality from ihrawdata where samplingmode=calculated
and calculationmode=Minselect timestamp, value, quality from ihrawdata where samplingmode=calculated
and calculationmode=MinimumTime and timestamp >= '29-Mar-2002 13:50' and
timestamp <= '29-Mar-2002 14:30' and tagname = DOWNSLOPE and numberofsamples = 8| Interval Time Stamp | Maximum | Maximum Time | Minimum | Minimum Time | Quality |
|---|---|---|---|---|---|
| 13:55:00.000 | 0.00 | 31-Dec-1969 19:00:00.000 | 0.00 | 31-Dec-1969 19:00:00.000 | 0.00 |
| 14:00:00.000 | 22.00 | 13:59:00.000 | 20.89 | 14:00:00.000 | 100.00 |
| 14:05:00.000 | 20.89 | 14:00:00.000 | 15.33 | 14:05:00.000 | 100.00 |
| 14:10:00.000 | 15.33 | 14:05:00.000 | 10.86 | 14:10:00.000 | 100.00 |
| 14:15:00.000 | 10.86 | 14:10:00.000 | 8.00 | 14:15:00.000 | 100.00 |
| 14:20:00.000 | 8.00 | 14:15:00.000 | 5.14 | 14:20:00.000 | 100.00 |
| 14:25:00.000 | 5.14 | 14:20:00.000 | 4.00 | 14:25:00.000 | 100.00 |
| 14:30:00.000 | 4.00 | 14:30:00.000 | 4.00 | 14:30:00.000 | 100.00 |
The value is 4 for the entire interval of 14:26:00 to 14:30:00. However, the newest value is always returned for MinimumTime and MaximumTime for an interval, so the values instead are calculated as 14:30.
All modes have the same quality. A MaximumTime or MinimumTime of 1969 means there is no value in that interval.
Maximum always begins at the start of the interval because the data forms this is a downwards-sloping line. The Maximum takes the sample interpolated at the interval start time. The timestamp is still the interval end time.
When an interval has no raw samples, such as in the 14:05 interval, samples are interpolated at the beginning and the end of the interval. This means that the 14:05 interval has 2 samples to example at when calculating the Minimum or Maximum.
Finding Minimum and Maximum of Changing Data
The following example uses a value that continually changes, rather than one that simply slopes upwards or downwards. Any Minimum or Maximum within an interval is necessarily a raw sample. If the minimum or maximum occurred as raw samples in the middle of the interval, these are also detected.
Import the following data:
[Tags]
Tagname,DataType,HiEngineeringUnits,LoEngineeringUnits
SAWTOOTH,SingleFloat,60,0
??
[Data]
Tagname,TimeStamp,Value,DataQuality
SAWTOOTH,29-Mar-2002 13:59:00.000,22.7,Good
SAWTOOTH,29-Mar-2002 14:01:00.000,12.5,Good
SAWTOOTH,29-Mar-2002 14:02:00.000,47.0,Good
SAWTOOTH,29-Mar-2002 14:03:00.000,2.4,Good
SAWTOOTH,29-Mar-2002 14:04:00.000,9.5,Good
SAWTOOTH,29-Mar-2002 14:08:00.000,12.5,Good
SAWTOOTH,29-Mar-2002 14:14:00.000,7.0,Good
SAWTOOTH,29-Mar-2002 14:22:00.000,4.8,Goodselect timestamp, value, quality from ihrawdata where
samplingmode=calculated and calculationmode=Maximum and timestamp >= '29-Mar-2002 13:50'
and timestamp <= '29-Mar-2002 14:30' and tagname = SAWTOOTH and numberofsamples = 8select timestamp, value, quality from ihrawdata where
samplingmode=calculated and calculationmode=MaximumTime and timestamp >= '29-Mar-2002 13:50'
and timestamp <= '29-Mar-2002 14:30' and tagname = SAWTOOTH and numberofsamples = 8select timestamp, value, quality from ihrawdata where
samplingmode=calculated and calculationmode=Minimum and timestamp >= '29-Mar-2002 13:50'
and timestamp <= '29-Mar-2002 14:30' and tagname = SAWTOOTH and numberofsamples = 8select timestamp, value, quality from ihrawdata where
samplingmode=calculated and calculationmode=MinimumTime and timestamp >= '29-Mar-2002 13:50'
and timestamp <= '29-Mar-2002 14:30' and tagname = SAWTOOTH and numberofsamples = 8| Interval Time Stamp | Maximum | Maximum Time | Minimum | Minimum Time | Quality |
|---|---|---|---|---|---|
| 13:55:00.000 | 0.00 | 31-Dec-1969 19:00:00.000 | 0.00 | 31-Dec-1969 19:00:00.000 | 0.00 |
| 14:00:00.000 | 22.70 | 13:59:00.000 | 17.60 | 14:00:00.000 | 100.00 |
| 14:05:00.000 | 47.00 | 14:02:00.000 | 2.40 | 14:03:00.000 | 100.00 |
| 14:10:00.000 | 12.50 | 14:08:00.000 | 10.25 | 14:03:00.000 | 100.00 |
| 14:15:00.000 | 10.67 | 14:10:00.000 | 6.73 | 14:15:00.000 | 100.00 |
| 14:20:00.000 | 6.73 | 14:15:00.000 | 5.35 | 14:20:00.000 | 100.00 |
| 14:25:00.000 | 4.80 | 14:20:00.000 | 4.80 | 14:25:00.000 | 100.00 |
| 14:30:00.000 | 4.80 | 14:30:00.000 | 4.80 | 14:30:00.000 | 100.00 |
Querying with a single interval so that all samples are included results in the following:
| Interval Time Stamp | Maximum | Maximum Time | Minimum | Minimum Time | Quality |
|---|---|---|---|---|---|
| 14:30:00.000 | 47.00 | 14:02:00.000 | 2.40 | 14:03:00.000 | 100.00 |
Finding the Minimum and Maximum with Bad Quality Data and Repeated Values
Import the following data:
[Tags]
Tagname,DataType,HiEngineeringUnits,LoEngineeringUnits
MINMAXBAD,SingleFloat,60,0
??
[Data]
Tagname,TimeStamp,Value,DataQuality
MINMAXBAD,29-Mar-2002 13:59:00.000,22.7,Good
MINMAXBAD,29-Mar-2002 14:01:00.000,12.5,Good
MINMAXBAD,29-Mar-2002 14:02:00.000,47.0,Bad
MINMAXBAD,29-Mar-2002 14:03:00.000,2.4,Bad
MINMAXBAD,29-Mar-2002 14:04:00.000,9.5,Good
MINMAXBAD,29-Mar-2002 14:08:00.000,12.5,Good
MINMAXBAD,29-Mar-2002 14:14:00.000,7.0,Good
MINMAXBAD,29-Mar-2002 14:22:00.000,4.8,Good| Interval Time Stamp | Maximum | Maximum Time | Minimum | Minimum Time | Quality |
|---|---|---|---|---|---|
| 14:30:00.000 | 22.70 | 13:59:00.00 | 4.80 | 14:30:00.000 | 100.00 |
Finding the amount of time the collector was running
The following example uses multiple intervals without a filter condition. If the data is good for the entire interval, the returned Value would be the length of the interval in milliseconds.
[Tags]
Tagname,DataType,HiEngineeringUnits,LoEngineeringUnits
BADDQTAG,SingleFloat,60,0
??
[Data]
Tagname,TimeStamp,Value,DataQuality
BADDQTAG,29-Mar-2002 13:59:00.000,22.7,Good
BADDQTAG,29-Mar-2002 14:08:00.000,12.5,Bad
BADDQTAG,29-Mar-2002 14:14:00.000,7.0,Bad
BADDQTAG,29-Mar-2002 14:22:00.000,4.8,Goodselect timestamp,value,intervalmilliseconds from ihRawData where
tagname = baddqtag and samplingmode=calculated and calculationmode=timegood
and timestamp > '29-mar-2002 13:55:00' and timestamp <'29-mar-2002 14:30:00'
and intervalmilliseconds=5m| Time Stamp | Value | Intervalmilliseconds |
|---|---|---|
| 29-Mar-2002 14:00:00.000 | 60,000.00 | 300,000 |
| 29-Mar-2002 14:05:00.000 | 300,000.00 | 300,000 |
| 29-Mar-2002 14:10:00.000 | 180,000.00 | 300,000 |
| 29-Mar-2002 14:15:00.000 | 0.00 | 300,000 |
| 29-Mar-2002 14:20:00.000 | 0.00 | 300,000 |
| 29-Mar-2002 14:25:00.000 | 180,000.00 | 300,000 |
- When data is good for the whole interval: From 14:01 to 14:05 the data is good, though no raw samples are contained. The value is equal to intervalmilliseconds (300,000).
- When data starts bad while entering the interval and then turns good: The data is bad going into the 14:21 to 14:25 interval, resulting in a value of 180,000 (out of 300,000).
- When data is bad from the middle of the interval to the end the interval: The data in the 14:06 to 14:10 interval starts with good quality and changes to bad quality. The value is therefore less than the calculated intervalmilliseconds (180,000 out of 300,000).
- When there are no raw samples in an interval: The number of raw
samples has no effect on the Value; it only affects the percent
quality
The interval from 14:01 to 14:05 contains no raw samples. The data quality throughout the entire interval is good. Therefore, for this interval, the Value is 300,000 (the length of the entire interval).
The interval from 14:16 to 14:20 contains no raw samples. The data quality throughout the entire interval is bad. At no time in this interval is there good data, so for this interval, the Value is 0.
select timestamp,value,intervalmilliseconds from ihRawData where
tagname = baddqtag and samplingmode=calculated and calculationmode=timegood and
timestamp >= '29-mar-2002 14:05:00' and timestamp <= '29-mar-2002 14:25:00' and
intervalmilliseconds=20m| Time Stamp | Value | Intervalmilliseconds |
|---|---|---|
| 29-Mar-2002 14:25:00.000 | 360,000.00 |
1,200,000 |
A value of 360,000 milliseconds corresponds to 3 minutes of good quality at the beginning of the interval and 3 minutes of good quality at the end of the interval.
Time Weighted Calculation Modes
The ihAverage and ihTotal and ihStandardDeviation modes use time-weighted calculations of interpolated and raw samples. The following example illustrates this concept using the ihAverage mode.
[Tags]
Tagname,DataType,HiEngineeringUnits,LoEngineeringUnits
TAG2,SingleFloat,60,0

[Data]
Tagname,TimeStamp,Value,DataQuality
TAG2,29-Mar-2002 14:00:00.000,30.0,Good
TAG2,29-Mar-2002 14:01:00.000,40.0,Good
TAG2,29-Mar-2002 14:01:10.000,50.0,Good
TAG2,29-Mar-2002 14:01:15.000,20.0,Bad
TAG2,29-Mar-2002 14:01:45.000,25.0,Good| Value | Duration |
|---|---|
| 30 | 60 seconds |
| 40 | 10 seconds |
| 50 | 5 seconds |
| 20 | 30 seconds |
| 25 | 15 seconds |
3/29/2002 14:00:00 - start time
3/29/2002 14:02:00 - end time
(40 + 50 + 25) / 3 = 38.33select timestamp, value, quality from ihrawdata where
samplingmode=calculated and calculationmode=RawAverage and timestamp >= '29-Mar-2002 14:00'
and timestamp <= '29-Mar-2002 14:02' and tagname = tag2 and numberofsamples = 1| Time Stamp | Value | Quality |
|---|---|---|
| 29-Mar-200214:02:00.000 | 38.33 | 100.00 |
The value of 30 is not used because the RawAverage mode uses only samples whose timestamps are greater than the interval's start time. A value whose timestamp is 14:00 would be associated with the previous interval.
((30 * 59.999) + (40 * 10) + (50 * 5) + (25*15)) / (60 + 10 + 5 + 15) = 31.38select timestamp, value, quality from ihrawdata where
samplingmode=calculated and calculationmode=Average and timestamp >= '29-Mar-2002 14:00'
and timestamp <= '29-Mar-2002 14:02' and tagname = tag2 and numberofsamples = 1This more closely describes the real situation, the value was 30 during most of the queried interval. The value of 30 is assigned to a timestamp of 14:00:00.001, which is the first possible timestamp greater than the interval start time (up to a resolution of milliseconds).
Computing an Average Without A Raw Sample At Start Time
There is rarely a raw sample available at the interval start time. However, the archiver needs to know the value at the start of an interval before it can perform time-weighted calculations. The archiver uses interpolation to get values it needs for which no raw samples are available.
For example, if we set the start time for the query to 14:05, then the archiver will interpolate a value at the timestamp of 14:05.
select timestamp, value, quality from ihrawdata where samplingmode=calculated and
calculationmode=RawAverage and timestamp >= '29-Mar-2002 14:00:05' and
timestamp <= '29-Mar-2002 14:02' and tagname = tag2 and numberofsamples = 1| Time Stamp | Value | Quality |
|---|---|---|
| 29-Mar-200214:02:00.000 | 38.33 | 100.00 |
select timestamp, value, quality from ihrawdata where samplingmode=calculated
and calculationmode=Average and timestamp >= '29-Mar-2002 14:00:05' and
timestamp <= '29-Mar-2002 14:02' and tagname = tag2 and numberofsamples = 1| Time Stamp | Value | Quality |
|---|---|---|
| 29-Mar-2002 14:02:00.000 | 32.01 | 73.91 |
Average and Step Values
The average of the raw samples is the interval, but there is special logic for time weighting and for computing the value at the start of the interval.
Averages are computed differently depending on the value of the Tag.StepValue property.
If StepValuee=FALSE then the average works as it always did in 2.0 and
3.0. A value at the start of the interval is determined via interpolation.
If StepValue=TRUE then lab sampling, not interpolation, is used to
determine the value at interval start time. This would more accurately reflect a value
that steps or a value that uses collector compression and did not change for a long
period of time.
ihTotal Mode
The ihTotal mode retrieves the time weighted rate total for each calculation interval.
A rate total is considered for totalizing a continuous measurement. A factor is applied to the totalized value to convert into the appropriate engineering units. Since this is a rate total, a base rate of Units/Day is assumed. If the actual units of the continuous measurement is Units/Minute, multiply the results by 1440 Minutes / Day to convert the totalized number into the appropriate engineering units.
The formula for total is total = average & (interval in milliseconds
/ 1000) / 86400. The 86400 is number of seconds in a day. This formula takes the
average, which is assumed to be already in units per day, and divides it into "units per
interval".
Collecting a Rate from a Data Source
Assume an average of 240 barrels per day.
If your interval is one day, then the "units per interval" is units per DAY. Since the average was already assumed to be in units per day, you just get back the average.
240 = 240 * (86400000/1000) / 86400
240 = 240 * 1
If your interval is 1 hour, you should get back 1/24 of the average.
total= 240 * (3600000/1000) / 86400
total = 240 * 0.0417
total = 10
Ten is 1/24 of 240 and tells you 10 units were produced that hour.
Filtered Data Queries
You can retrieve data using an optional filter tag or filter expression if the client program or API you are using supports it.
Normally, a data query specifies a start and an end time for the query. Data is returned for ALL intervals between the start and end times. A filtered data query allows you to specify a filter tag or expression with additional criteria so that only some of those intervals which match the filter conditions are returned. The method of calculating the value attributed to the interval can be different from a non-filtered query, since the filter criteria can exclude raw samples inside an interval as well as exclude intervals themselves.
The value that triggers a transition from FALSE to TRUE can be a raw value or interpolated value. If a FilterTag or expression is supplied, the Data Archiver attempts to filter time periods from the results.
The filter data query parameters include:
- FilterTag or FilterExpression
- FilterMode
- FilterComparisonMode
- FilterComparisonValue
Each parameter is described in the following table with examples that demonstrate common usages.
Internally to the Data Archiver, the filter condition is evaluated to get zero or more time ranges. For example, if you query from 1pm to 2pm and the filter condition was never TRUE during that time, nothing is returned.
If the condition was TRUE from 1:40 to 1:45 then only the data for that time range is queried and returned. Together the Filter Tag, Filter value, and Filter Comparison Mode define the criteria to apply to each interval to determine inclusion or exclusion. You can optionally use Filter Expression to include all the above parameters in one condition.
The Include Times defines how the time periods before and after transitions in the filter condition should be handled. An example with actual data and a graphic to clarify the behavior of each of the IncludeTime options is provided in the following topics.
You can retrieve data using a filtered data query or filter expressions.
Using a Filtered Data Query
- Which time ranges should be included? In the following example, you see that No Filter mode returns all intervals. Each mode has its own logic to determine if an interval passes the filter or not.
- What value and quality should be attributed to the interval? If the filter condition is TRUE for the whole interval, then this is just like the non-filtered result. When the filter condition is TRUE only for part of the inter- val, raw samples get filtered out, changing the values returned.
* Example for Filtered Data Documentation
*
[Tags]
Tagname,DataType,HiEngineeringUnits,LoEngineeringUnits
BATCHID,VariableString,10,0
RAMP,SingleInteger,60,0
ONOFF,SingleInteger,60,0
HAS SPACE,SingleInteger,60,0
[Data]
Tagname,TimeStamp,Value,DataQuality
BATCHID,30-Jul-2002 07:00:00.000,B1,Good
BATCHID,30-Jul-2002 07:00:20.000,B2,Good
BATCHID,30-Jul-2002 07:00:34.000,B3,Good
BATCHID,30-Jul-2002 07:00:52.000,B1,Good
RAMP,30-Jul-2002 07:00:00.000,0,Good
RAMP,30-Jul-2002 07:00:01.000,1,Good
RAMP,30-Jul-2002 07:00:02.000,2,Good
RAMP,30-Jul-2002 07:00:03.000,3,Good
RAMP,30-Jul-2002 07:00:04.000,4,Good
RAMP,30-Jul-2002 07:00:05.000,5,Good
RAMP,30-Jul-2002 07:00:06.000,6,Good
RAMP,30-Jul-2002 07:00:07.000,7,Good
RAMP,30-Jul-2002 07:00:08.000,8,Good
RAMP,30-Jul-2002 07:00:09.000,9,Good
RAMP,30-Jul-2002 07:00:10.000,10,Good
RAMP,30-Jul-2002 07:00:11.000,11,Good
RAMP,30-Jul-2002 07:00:12.000,12,Good
RAMP,30-Jul-2002 07:00:13.000,13,Good
RAMP,30-Jul-2002 07:00:14.000,14,Good
RAMP,30-Jul-2002 07:00:15.000,15,Good
RAMP,30-Jul-2002 07:00:16.000,16,Good
RAMP,30-Jul-2002 07:00:17.000,17,Good
RAMP,30-Jul-2002 07:00:18.000,18,Good
RAMP,30-Jul-2002 07:00:19.000,19,Good
RAMP,30-Jul-2002 07:00:20.000,20,Good
RAMP,30-Jul-2002 07:00:21.000,21,Good
RAMP,30-Jul-2002 07:00:22.000,22,Good
RAMP,30-Jul-2002 07:00:23.000,23,Good
RAMP,30-Jul-2002 07:00:24.000,24,Good
RAMP,30-Jul-2002 07:00:25.000,25,Good
RAMP,30-Jul-2002 07:00:26.000,26,Good
RAMP,30-Jul-2002 07:00:27.000,27,Good
RAMP,30-Jul-2002 07:00:28.000,28,Good
RAMP,30-Jul-2002 07:00:29.000,29,Good
RAMP,30-Jul-2002 07:00:30.000,30,Good
RAMP,30-Jul-2002 07:00:31.000,31,Good
RAMP,30-Jul-2002 07:00:32.000,32,Good
RAMP,30-Jul-2002 07:00:33.000,33,Good
RAMP,30-Jul-2002 07:00:34.000,34,Good
RAMP,30-Jul-2002 07:00:35.000,35,Good
RAMP,30-Jul-2002 07:00:36.000,36,Good
RAMP,30-Jul-2002 07:00:37.000,37,Good
RAMP,30-Jul-2002 07:00:38.000,38,Good
RAMP,30-Jul-2002 07:00:39.000,39,Good
RAMP,30-Jul-2002 07:00:40.000,40,Good
RAMP,30-Jul-2002 07:00:41.000,41,Good
RAMP,30-Jul-2002 07:00:42.000,42,Good
RAMP,30-Jul-2002 07:00:43.000,43,Good
RAMP,30-Jul-2002 07:00:44.000,44,Good
RAMP,30-Jul-2002 07:00:45.000,45,Good
RAMP,30-Jul-2002 07:00:46.000,46,Good
RAMP,30-Jul-2002 07:00:47.000,47,Good
RAMP,30-Jul-2002 07:00:48.000,48,Good
RAMP,30-Jul-2002 07:00:49.000,49,Good
RAMP,30-Jul-2002 07:00:50.000,50,Good
RAMP,30-Jul-2002 07:00:51.000,51,Good
RAMP,30-Jul-2002 07:00:52.000,52,Good
RAMP,30-Jul-2002 07:00:53.000,53,Good
RAMP,30-Jul-2002 07:00:54.000,54,Good
RAMP,30-Jul-2002 07:00:55.000,55,Good
RAMP,30-Jul-2002 07:00:56.000,56,Good
RAMP,30-Jul-2002 07:00:57.000,57,Good
RAMP,30-Jul-2002 07:00:58.000,58,Good
RAMP,30-Jul-2002 07:00:59.000,59,Good
ONOFF,30-Jul-2002 07:00:00.000,0,Good
ONOFF,30-Jul-2002 07:00:01.000,1,Good
ONOFF,30-Jul-2002 07:01:01.000,0,Good
ONOFF,30-Jul-2002 07:01:16.000,0,Good
ONOFF,30-Jul-2002 07:01:17.000,1,Good
ONOFF,30-Jul-2002 07:01:18.000,1,Good
ONOFF,30-Jul-2002 07:02:01.000,1,Good
ONOFF,30-Jul-2002 07:03:01.000,0,Good
HAS SPACE,30-Jul-2002 07:00:00.000,0,Good
HAS SPACE,30-Jul-2002 07:00:01.000,1,Good
HAS SPACE,30-Jul-2002 07:01:01.000,0,Good
HAS SPACE,30-Jul-2002 07:01:16.000,0,Good
HAS SPACE,30-Jul-2002 07:01:17.000,1,Good
HAS SPACE,30-Jul-2002 07:01:18.000,1,Good
HAS SPACE,30-Jul-2002 07:02:01.000,1,Good
HAS SPACE,30-Jul-2002 07:03:01.000,0,GoodBATCHID,30-Jul-2002 07:00:00.000,B1,Good
BATCHID,30-Jul-2002 07:00:20.000,B2,Good
BATCHID,30-Jul-2002 07:00:34.000,B3,Good
BATCHID,30-Jul-2002 07:00:52.000,B1,GoodIn this system, since the batch ID is written at the start of the batch, you can tell that batch B1 ran from 07:00:01 to 07:00:19 and then batch B2 ran. This assumes that all time is attributable to some batch and there is no dead time between batches. If there is equipment downtime after a batch, you need to write some other value to the batch ID tag to indicate the end time of the batch.
| Query Parameter | Value |
|---|---|
| Start Time | 07/30/2002 07:00:00 |
| End Time | 07/30/2002 07:01:00 |
| Interval | 10 seconds |
Using Filter Expressions
You can enter filter expressions in filtered data queries to indicate the desired time range. A Filter Expression has one or more filter conditions.
A filter condition has:
- A Historian tag
- A comparison (=, !=, >, <, <=, >=, ^, ~, !~, !^)
- A value
For example: mytag < 7
You can add more than one filter condition in a filter expression using AND, OR within a parenthesis. For example: (mytag > 3) and (mytag < 7).
You can use bitwise comparison for a tag. By using bitwise comparison you can compare the binary values of the given filter tag with the bits specified in the condition. The Bitwise comparison modes are:
- AllBitssSet (^)
- AnyBitSet (~)
- AnyBitNotSet (!~)
- AllBitsNotSet (!^)
While using filter expression you should remember the following things:
- You cannot use a NOT operator; you can use != instead.
- You cannot do mathematical operations such as (mytag1+7) > 15.
- You cannot compare two tags such as mytag1 > mytag2.
Your conditions can only include values and not qualities. Values are used only if they are of good quality so you need not check the quality separately. As with any filtered data query, the filter expression determines the time ranges of the data returned. There is no maximum length for an expression but a typical expression will be have 1 or 3 conditions.
*
[Tags]
Tagname,DataType,HiEngineeringUnits,LoEngineeringUnits
BATCHID,VariableString,10,0
RAMP,SingleInteger,60,0
ONOFF,SingleInteger,60,0
HAS SPACE,SingleInteger,60,0
[Data]
Tagname,TimeStamp,Value,DataQuality
BATCHID,30-Jul-2002 07:00:00.000,B1,Good
BATCHID,30-Jul-2002 07:00:20.000,B2,Good
BATCHID,30-Jul-2002 07:00:34.000,B3,Good
BATCHID,30-Jul-2002 07:00:52.000,B1,Good
RAMP,30-Jul-2002 07:00:00.000,0,Good
RAMP,30-Jul-2002 07:00:01.000,1,Good
RAMP,30-Jul-2002 07:00:02.000,2,Good
RAMP,30-Jul-2002 07:00:03.000,3,Good
RAMP,30-Jul-2002 07:00:04.000,4,Good
RAMP,30-Jul-2002 07:00:05.000,5,Good
RAMP,30-Jul-2002 07:00:06.000,6,Good
RAMP,30-Jul-2002 07:00:07.000,7,Good
RAMP,30-Jul-2002 07:00:08.000,8,Good
RAMP,30-Jul-2002 07:00:09.000,9,Good
RAMP,30-Jul-2002 07:00:10.000,10,Good
RAMP,30-Jul-2002 07:00:11.000,11,Good
RAMP,30-Jul-2002 07:00:12.000,12,Good
RAMP,30-Jul-2002 07:00:13.000,13,Good
RAMP,30-Jul-2002 07:00:14.000,14,Good
RAMP,30-Jul-2002 07:00:15.000,15,Good
RAMP,30-Jul-2002 07:00:16.000,16,Good
RAMP,30-Jul-2002 07:00:17.000,17,Good
RAMP,30-Jul-2002 07:00:18.000,18,Good
RAMP,30-Jul-2002 07:00:19.000,19,Good
RAMP,30-Jul-2002 07:00:20.000,20,Good
RAMP,30-Jul-2002 07:00:21.000,21,Good
RAMP,30-Jul-2002 07:00:22.000,22,Good
RAMP,30-Jul-2002 07:00:23.000,23,Good
RAMP,30-Jul-2002 07:00:24.000,24,Good
RAMP,30-Jul-2002 07:00:25.000,25,Good
RAMP,30-Jul-2002 07:00:26.000,26,Good
RAMP,30-Jul-2002 07:00:27.000,27,Good
RAMP,30-Jul-2002 07:00:28.000,28,Good
RAMP,30-Jul-2002 07:00:29.000,29,Good
RAMP,30-Jul-2002 07:00:30.000,30,Good
RAMP,30-Jul-2002 07:00:31.000,31,Good
RAMP,30-Jul-2002 07:00:32.000,32,Good
RAMP,30-Jul-2002 07:00:33.000,33,Good
RAMP,30-Jul-2002 07:00:34.000,34,Good
RAMP,30-Jul-2002 07:00:35.000,35,Good
RAMP,30-Jul-2002 07:00:36.000,36,Good
RAMP,30-Jul-2002 07:00:37.000,37,Good
RAMP,30-Jul-2002 07:00:38.000,38,Good
RAMP,30-Jul-2002 07:00:39.000,39,Good
RAMP,30-Jul-2002 07:00:40.000,40,Good
RAMP,30-Jul-2002 07:00:41.000,41,Good
RAMP,30-Jul-2002 07:00:42.000,42,Good
RAMP,30-Jul-2002 07:00:43.000,43,Good
RAMP,30-Jul-2002 07:00:44.000,44,Good
RAMP,30-Jul-2002 07:00:45.000,45,Good
RAMP,30-Jul-2002 07:00:46.000,46,Good
RAMP,30-Jul-2002 07:00:47.000,47,Good
RAMP,30-Jul-2002 07:00:48.000,48,Good
RAMP,30-Jul-2002 07:00:49.000,49,Good
RAMP,30-Jul-2002 07:00:50.000,50,Good
RAMP,30-Jul-2002 07:00:51.000,51,Good
RAMP,30-Jul-2002 07:00:52.000,52,Good
RAMP,30-Jul-2002 07:00:53.000,53,Good
RAMP,30-Jul-2002 07:00:54.000,54,Good
RAMP,30-Jul-2002 07:00:55.000,55,Good
RAMP,30-Jul-2002 07:00:56.000,56,Good
RAMP,30-Jul-2002 07:00:57.000,57,Good
RAMP,30-Jul-2002 07:00:58.000,58,Good
RAMP,30-Jul-2002 07:00:59.000,59,Good
ONOFF,30-Jul-2002 07:00:00.000,0,Good
ONOFF,30-Jul-2002 07:00:01.000,1,Good
ONOFF,30-Jul-2002 07:01:01.000,0,Good
ONOFF,30-Jul-2002 07:01:16.000,0,Good
ONOFF,30-Jul-2002 07:01:17.000,1,Good
ONOFF,30-Jul-2002 07:01:18.000,1,Good
ONOFF,30-Jul-2002 07:02:01.000,1,Good
ONOFF,30-Jul-2002 07:03:01.000,0,Good
HAS SPACE,30-Jul-2002 07:00:00.000,0,Good
HAS SPACE,30-Jul-2002 07:00:01.000,1,Good
HAS SPACE,30-Jul-2002 07:01:01.000,0,Good
HAS SPACE,30-Jul-2002 07:01:16.000,0,Good
HAS SPACE,30-Jul-2002 07:01:17.000,1,Good
HAS SPACE,30-Jul-2002 07:01:18.000,1,Good
HAS SPACE,30-Jul-2002 07:02:01.000,1,Good
HAS SPACE,30-Jul-2002 07:03:01.000,0,GoodFor the following scenarios, import the data tags provided.
Other Calculation Modes
STATECOUNT
The STATECOUNT calculation mode counts the number of times a tag has transitioned to another state from a previous state. A state transition is counted when the previous good sample is not equal to the state value and the next good sample is equal to state value.
- Value: The number of transitions into the state in a given time interval.
- Quality: The percent good is 100 if there are no bad samples within the time interval. Otherwise, the percent good is the percent of interval time that the value was of good quality.
- Anticipated usage: The STATECOUNT calculation mode is useful to determine the number of times a value transitioned to a certain state such as when a digital state was turned on or the enumerated value was of certain value. It should mostly be used with integer values because it may not exactly match a float state value due to rounding.
STATETIME Calculation Mode: The STATETIME calculation mode retrieves the duration that a tag was in a given state within an interval.
- Value: The STATETIME calculation mode retrieves the total number of milliseconds during the interval for which the data was in the state value.
- Quality:
The percent good is 100 if the data is good quality for the entire the time interval.
Import this data to use in the examples.[Tags] Tagname,DataType,HiEngineeringUnits,LoEngineeringUnits STATECOUNTTAG,SingleInteger,60,0 STATEBADTAG,SingleInteger,60,0 STATEBADTAG2,SingleInteger,60,0 [Data] Tagname,TimeStamp,Value,DataQuality STATECOUNTTAG,06-Aug-2012 8:59:00.000,2,Good STATECOUNTTAG,06-Aug-2012 9:08:00.000,4,Good STATECOUNTTAG,06-Aug-2012 9:14:00.000,4,Good STATECOUNTTAG,06-Aug-2012 9:22:00.000,2,Good STATEBADTAG,06-Aug-2012 8:59:00.000,2,Good STATEBADTAG,06-Aug-2012 9:08:00.000,0,Bad STATEBADTAG,06-Aug-2012 9:14:00.000,2,Good STATEBADTAG,06-Aug-2012 9:22:00.000,4,Good STATEBADTAG2,06-Aug-2012 8:59:00.000,2,Good STATEBADTAG2,06-Aug-2012 9:08:00.000,0,Bad STATEBADTAG2,06-Aug-2012 9:14:00.000,4,Good STATEBADTAG2,06-Aug-2012 9:22:00.000,2,Good - Anticipated usage: The STATETIME calculation mode is useful to determine the duration the tag was in a particular state. For example, if a tag records the state of a motor you can use state count to determine the duration a motor was in idle state.
OPCQOR and OPCQAND Calculation Modes:
The OPCQOR calculation mode is a bit-wise OR operation of all the 16 bit OPC qualities of the raw samples stored in the specified interval. This calculation mode can be used only if you have set the ???Store OPC Quality to ???Enabled in Historian Administrator and your data is coming from an OPC Collector.
The OPCQAND calculation mode is a bit wise AND operation of all the 16 bit OPC qualities of the raw samples stored in the specified interval. This calculation mode can be used only if you have set the ???Store OPC Quality to Enabled in Historian Administrator and your data is coming from an OPC Collector.
When collecting data from OPC servers, the Historian OPC collector will convert the 16 bits of OPC quality to a Historian quality and subquality. When ???Store OPC Quality is enabled, the 16 bits are also stored with the data and can be retrieved here.
Use the returned value from OPCQOR like a data quality. By using OPCQOR and OPCQAND values, you can see if a condition occurred during an interval and therefore know how trustworthy your returned data is.
- Value: The 16 bits are in the following format:
VVVVVVVVQQSSSSSS
The first 16 bits are for vendor to fill in. The next two are the actual quality, good, bad,uncertain. The rest of the bits are subquality.
- OPC good is a decimal 192 which is binary 0000000011000000.
- OPC bad is all zeros 0000000000000000.
- Quality: The percent good is 100 if all the samples have good Historian quality. The Historian quality is based on the OPC quality but both the qualities are not the same.
- Anticipated usage:
The OPCQOR and OPCQAND calculation modes are useful if you want to the know the quality of your samples between a time interval. For example,if you want to know how many of your samples from 3pm to 4pm had the following quality:
- All good - If you do an OPCAND from 3 P.M. to 4 P.M and get the result as 0000000011000000 which is 192 decimal, it means that the value was good for the whole time.
- All bad - If OPCOR returns 0, then the data was bad the whole time.
- Some bad - If you do a OPCOR and get the result as 0000000011000000 which is 192 decimal, it means that there were at least some good values. If you do an OPCAND and get the result as 0000000000000000, it means that at least some data was bad.
tag1 the result will be tag1.Min which is the
result of the minimum calculation mode and tag1.Max, the result of the
maximum calculation mode. The calculation mode is appended to the tagname. - Value: A query will return multiple values for the same timestamp. They are the results of each individual calculation mode. For more information on different Calculation Modes, refer to the corresponding sections
- Quality: There is no single overall quality for the query, only a quality per calculation mode.
Calculating the state count of good quality data
This example shows a simple case of counting state transitions. In this example, the value 4 means that a machine is running so we want to count the number of times the tag transitioned from some other value to 4.
Import the following data.
[Tags]
Tagname,DataType,HiEngineeringUnits,LoEngineeringUnits
STATECOUNTTAG,SingleInteger,60,0
STATEBADTAG,SingleInteger,60,0
STATEBADTAG2,SingleInteger,60,0
[Data]
Tagname,TimeStamp,Value,DataQuality
STATECOUNTTAG,06-Aug-2012 8:59:00.000,2,Good
STATECOUNTTAG,06-Aug-2012 9:08:00.000,4,Good
STATECOUNTTAG,06-Aug-2012 9:14:00.000,4,Good
STATECOUNTTAG,06-Aug-2012 9:22:00.000,2,Good
STATEBADTAG,06-Aug-2012 8:59:00.000,2,Good
STATEBADTAG,06-Aug-2012 9:08:00.000,0,Bad
STATEBADTAG,06-Aug-2012 9:14:00.000,2,Good
STATEBADTAG,06-Aug-2012 9:22:00.000,4,Good
STATEBADTAG2,06-Aug-2012 8:59:00.000,2,Good
STATEBADTAG2,06-Aug-2012 9:08:00.000,0,Bad
STATEBADTAG2,06-Aug-2012 9:14:00.000,4,Good
STATEBADTAG2,06-Aug-2012 9:22:00.000,2,GoodExecute the following query in Historian Interactive SQL:
set starttime='08/06/2012 8:00:00',endtime='08/06/2012 10:00:00'
select timestamp,value,quality from ihrawdata where tagname = STATECOUNTTAG and samplingmode=Calculation and
CalculationMode=StateCount and IntervalMilliseconds=20m and statevalue=4
The following results are returned:
| Time Stamp | Value | Quality |
|---|---|---|
| 8/6/2012 08:20:00 | 0.000000000000 | 0.0000000 |
| 8/6/2012 08:40:00 | 0.000000000000 | 0.0000000 |
| 8/6/2012 09:00:00 | 0.000000000000 | 5.0000000 |
| 8/6/2012 09:40:00 | 1.000000000000 | 100.0000000 |
| 8/6/2012 09:40:00 | 0.000000000000 | 100.0000000 |
| 8/6/2012 10:00:00 | 0.000000000000 | 100.0000000 |
Note that the transition from 2 to 4 (machine started running) happened at 9:08, so it is included in the 9:00 to 9:20 interval.
The data was of bad quality until 8:59:00 which is for 1 minute of the 20 minute interval. The percent good for that interval is 5.
There are two samples with the value 4. We do not count the number of times the statevalue occurred, but the number of transitions from some other value to the state value.
We only count transitions into the state value not out of the state value. So, the transition from 4 to 2 is not counted.
Calculating the state count of bad quality data
Note that this tag had a bad data sample when the collector was restarted. This does not, however, affect the state count.
Run the following query:
set starttime='08/06/2012 8:00:00',endtime='08/06/2012 10:00:00'
select timestamp,value,quality from ihrawdata where tagname = STATEBADTAG and samplingmode=Calculation and
CalculationMode=StateCount and IntervalMilliseconds=20m and statevalue=4
The following results are returned:
| Time Stamp | Value | Quality |
|---|---|---|
| 8/6/2012 08:20:00 | 0.000000000000 | 0.0000000 |
| 8/6/2012 08:40:00 | 0.000000000000 | 0.0000000 |
| 8/6/2012 09:00:00 | 0.000000000000 | 5.0000000 |
| 8/6/2012 09:20:00 | 0.000000000000 | 70.0000000 |
| 8/6/2012 09:40:00 | 1.000000000000 | 100.0000000 |
| 8/6/2012 10:00:00 | 0.000000000000 | 100.0000000 |
Note that the bad value is ignored and the state change that happened at 9:22 is counted. We do not know if the machine had started and stopped while the collector was shutdown.
If the value did change to running while the collector was shut down then that change is counted as in shown in the following example:
set starttime='08/06/2012 8:00:00',endtime='08/06/2012 10:00:00'
select timestamp,value,quality from ihrawdata where tagname = STATEBADTAG2 and samplingmode=Calculation and
CalculationMode=StateCount and IntervalMilliseconds=20m and statevalue=4| Time Stamp | Value | Quality |
|---|---|---|
| 8/6/2012 08:20:00 | 0.000000000000 | 0.0000000 |
| 8/6/2012 08:40:00 | 0.000000000000 | 0.0000000 |
| 8/6/2012 09:00:00 | 0.000000000000 | 5.0000000 |
| 8/6/2012 09:20:00 | 1.000000000000 | 70.0000000 |
| 8/6/2012 09:40:00 | 0.000000000000 | 100.0000000 |
| 8/6/2012 10:00:00 | 0.000000000000 | 100.0000000 |
Calculating the state count of enumerated set data
When querying a tag that uses enumerated sets, use the string state name as the state value.
Using the data from previous example, assume that the STATECOUNTTAG had an enumerated set with the values as 2=Stopped and 4=Running.
You should use this query with statevalue of Running instead of the native value 4.
set starttime='08/06/2012 8:00:00',endtime='08/06/2012 10:00:00'
select timestamp,value,quality from ihrawdata where tagname = STATECOUNTTAG and samplingmode=Calculation and
CalculationMode=StateCount and IntervalMilliseconds=20m and statevalue='Running'
The results match with the results when statevalue=4 is used.
| Time Stamp | Value | Quality |
|---|---|---|
| 8/6/2012 08:20:00 | 0.000000000000 | 0.0000000 |
| 8/6/2012 08:40:00 | 0.000000000000 | 0.0000000 |
| 8/6/2012 09:00:00 | 0.000000000000 | 5.0000000 |
| 8/6/2012 09:20:00 | 1.000000000000 | 100.0000000 |
| 8/6/2012 09:40:00 | 0.000000000000 | 100.0000000 |
| 8/6/2012 10:00:00 | 0.000000000000 | 100.0000000 |
Calculating the state time of good quality data
set starttime='08/06/2012 8:00:00',endtime='08/06/2012 10:00:00'
select timestamp,value,quality from ihrawdata where tagname = STATECOUNTTAG and samplingmode=Calculation and
CalculationMode=StateTime and IntervalMilliseconds=20m and statevalue=4| Time Stamp | Value | Quality |
|---|---|---|
| 8/6/2012 08:20:00 | 0.000000000000 | 0.0000000 |
| 8/6/2012 08:40:00 | 0.000000000000 | 0.0000000 |
| 8/6/2012 09:00:00 | 0.000000000000 | 5.0000000 |
| 8/6/2012 09:20:00 | 720,000.000000000000 | 100.0000000 |
| 8/6/2012 09:40:00 | 120,0.000000000000 | 100.0000000 |
| 8/6/2012 10:00:00 | 0.000000000000 | 100.0000000 |
A 20 minute interval is 20*60*1000=1200000 milliseconds. In the 9:00 to 9:20 interval the value was in state 4 from 9:08 to 9:20 which is 12 minutes * 60 *1000 = 720000 milliseconds.
In the 9:20 to 9:40 interval the value was in state 4 from 9:20 to 9:22 which is 2*60*1000 = 120000 milliseconds.
Calculating the state time of bad quality data
This tag has a bad data sample such as when the collector was restarted. A new value is recorded when the collector is started.
set starttime='08/06/2012 8:00:00',endtime='08/06/2012 10:00:00'
select timestamp,value,quality from ihrawdata where tagname = STATEBADTAG2 and samplingmode=Calculation and
CalculationMode=StateTime and IntervalMilliseconds=20m and statevalue=4

Tagname,TimeStamp,Value,DataQuality
STATEBADTAG2,06-Aug-2012 8:59:00.000,2,Good
STATEBADTAG2,06-Aug-2012 9:08:00.000,0,Bad
STATEBADTAG2,06-Aug-2012 9:14:00.000,4,Good
STATEBADTAG2,06-Aug-2012 9:22:00.000,2,Good
The following results are returned:
| Time Stamp | Value | Quality |
|---|---|---|
| 8/6/2012 08:20:00 | 0.000000000000 | 0.0000000 |
| 8/6/2012 08:40:00 | 0.000000000000 | 0.0000000 |
| 8/6/2012 09:00:00 | 0.000000000000 | 5.0000000 |
| 8/6/2012 09:20:00 | 360,000.000000000000 | 70.0000000 |
| 8/6/2012 09:40:00 | 120,000.000000000000 | 100.0000000 |
| 8/6/2012 10:00:00 | 0.000000000000 | 100.0000000 |
In the interval between 9:00 to 9:20, the value was in state 4 from 9:14 to 9:20 = 6 minutes * 60 * 1000 = 360000 milliseconds.
In the interval between 9:20 to 9:40, the value was in state 4 from 9:20 to 9:22 = 2 minutes * 60 * 1000 = 120000 milliseconds.
Calculating the OPCQOR
The following is the data set used to run the query on.
TagName,Timestamp,Value
DATA1:Bad-0 OPC-(60)(08/09/12 18:00:01.000,Val=10
DATA2:Bad-0 OPC-(59)(08/09/12 18:00:02.000,Val=10
DATA3:Bad-0 OPC-(58)(08/09/12 18:00:03.000),Val=10
DATA4:Bad-0 OPC-(57)(08/09/12 18:00:04.000),Val=10
DATA5:Bad-0 OPC-(56)(08/09/12 18:00:05.000),Val=10
DATA6:Bad-0 OPC-(55)(08/09/12 18:00:06.000),Val=10
DATA7:Bad-0 OPC-(54)(08/09/12 18:00:07.000),Val=10
DATA8:Bad-0 OPC-(53)(08/09/12 18:00:08.000),Val=10
DATA9:Bad-0 OPC-(52)(08/09/12 18:00:09.000),Val=10
DATA10:Bad-0 OPC-(51)(08/09/12 18:00:10.000),Val=10
DATA11:Bad-0 OPC-(50)(08/09/12 18:00:11.000),Val=10
The following query retrieves the OPCQOR data with a start time of 18:00:00 and end time of 18:00:10 with a 2 second time interval.
set starttime='08/09/2012 18:00:00',endtime='08/09/2012 18:00:10'
select tagname,timestamp,value,Quality from ihrawdata where tagname like OPCQualityDataTag and samplingmode=Calculated
and calculationmode=OPCQOR and IntervalMilliseconds=2S
The following output is retrieved.
| Tag Name | Time Stamp | Value | Quality |
|---|---|---|---|
| OPCQualityDataTag | 8/9/2012 18:00:02 | 63.000000000000 | 50.0000000 |
| OPCQualityDataTag | 8/9/2012 18:00:04 | 59.000000000000 | 100.0000000 |
| OPCQualityDataTag | 8/9/2012 18:00:06 | 63.000000000000 | 100.0000000 |
| OPCQualityDataTag | 8/9/2012 18:00:08 | 55.000000000000 | 100.0000000 |
| OPCQualityDataTag | 8/9/2012 18:00:10 | 55.000000000000 | 100.0000000 |
Calculating the OPCQAND
The following query retrieves the OPCQAND data with a start time of 18:00:00 and end time of 18:00:10 with a 2 second time interval.
set starttime='08/09/2012 18:00:00',endtime='08/09/2012 18:00:10'
select tagname,timestamp,value,Quality,opcquality from ihrawdata where tagname like OPCQualityDataTag and
samplingmode=Calculated and calculationmode=OPCQAND and IntervalMilliseconds=2S
he following output is retrieved.
| Tag Name | Time Stamp | Value | Quality |
|---|---|---|---|
| OPCQualityDataTag | 8/9/2012 18:00:02 | 50.0000000 | 0 |
| OPCQualityDataTag | 8/9/2012 18:00:04 | 100.0000000 | 0 |
| OPCQualityDataTag | 8/9/2012 18:00:06 | 100.0000000 | 0 |
| OPCQualityDataTag | 8/9/2012 18:00: | 100.0000000 | 0 |
| OPCQualityDataTag | 8/9/2012 18:00:10 | 100.0000000 | 0 |
Using TagStats Calculation Mode
This image displays the TagStats calculation mode example in the Proficy Historian Interactive SQL Application.
In this example we perform the calculations
for a single interval by giving numberofsamples=1.
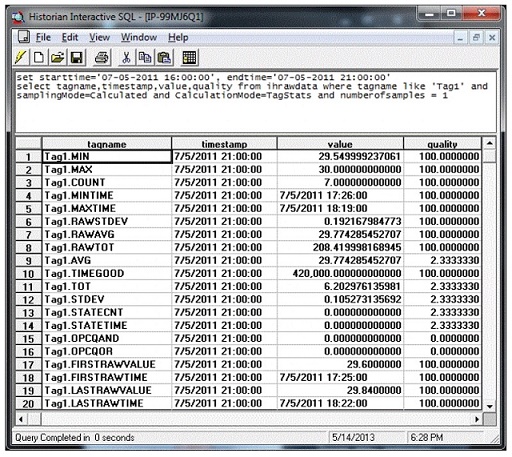
StepValue Tag Property
Retrieval generally does not take into account how a value changes. When retrieving data from the archive, Historian will attempt to interpolate it, which may result in an inaccurate representation of the data's real world changes, such as that shown in the following figure.
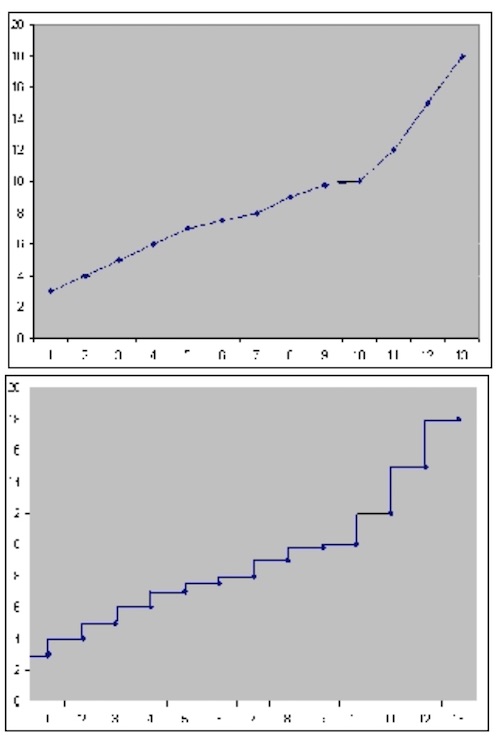
In order for Historian to know that a tag did not ramp down between reported values, the StepValue tag property must be applied. This tag property is used to indicate that the value in the real world changes in a sharp step instead of a smooth linear interpolation. An example would be a digital signal that quickly goes 0 to 1. Or, a flow rate that goes 5 to 25 when an upstream valve is opened.
- Example: Reporting Step Change
-
Copy and paste the following into an empty CSV file and import the file with the File collector.
[Tags]
Tagname,DataType,HiEngineeringUnits,LoEngineeringUnits
TAG1,SingleFloat,100,0
[Data]
Tagname,TimeStamp,Value,DataQuality
tag1,9/19/05 05:15:00,26.41,Good
tag1,9/19/05 06:15:00,26.45,Good
tag1,9/19/05 07:15:00,26.59,Good
tag1,9/19/05 08:15:00,26.58,Good
tag1,9/19/05 09:15:00,26.36,Good
tag1,9/19/05 10:15:00,10.74,Good
tag1,9/19/05 11:15:00,11.00,Good
tag1,9/19/05 12:15:00,10.94,Good
tag1,9/19/05 13:15:00,11.03,Good
Set the StepValue=TRUE in Historian Administrator. Then, use the following query to retrieve data using Average with a 15 minute interval.
select * from ihrawdata where tagname=TAG1 and timestamp > '9/19/05 09:30:00'
and timestamp <= '9/19/05 11:30:00' and calculationmode=average and
intervalmilliseconds=15m
You will see the following results, which show two distinct steps:
Value Quality 09:45:00 26.36 10:00:00 26.36 10:15:00 26.36 10:30:00 10.74 10:45:00 10.74 11:00:00 10.74 11:15:00 10.74 11:30:00 11.00 If you set the
StepValue=FALSEand run the same query, you will see the following results, which reflect interpolated values.Value Quality 09:45:00 22.46 10:00:00 18.55 10:15:00 14.64 10:30:00 10.74 10:45:00 10.80 11:00:00 10.87 11:15:00 10.93 11:30:00 11.00 - Example: No raw sample at start time
-
Copy and paste these lines into an empty CSV file and import the file with the File collector
[Tags]
Tagname,DataType,HiEngineeringUnits,LoEngineeringUnits,StepValue
TAG2,SingleFloat,100,0,TRUE
[Data]
Tagname,TimeStamp,Value,DataQuality
TAG2,9/19/05 13:59:00.000,22,Good
TAG2,9/19/05 14:08:00.000,12,Good
TAG2,9/19/05 14:22:00.000,4,Good
Use the following query to retrieve the data using Average with a 30 minute interval
select * from ihrawdata where tagname=tag2 and timestamp >
'9/19/05 14:00:00' and timestamp <= '9/19/05 14:30:00' and
calculationmode=average and intervalmilliseconds=30m
You will see the following results.
Time Stamp Value Quality 14:30:00 12.53 100.00 The following table is another way to look at the data as values and durations.
Point Value Duration (Seconds) Point 1 22.00 480 (lab sampled at start) Point 3 12 1320 Point 4 4 480 The step value average would be:
((22.00 * 480) + (12 * 840) + (4 * 480)) / (480 + 840 + 480) = 12.53The percent good is 100 since it was good the whole time.
The interpolated average is 12.24 because the first sample is different.
Point Value Duration (Seconds) Point 1 20.88 480 (lab sampled at start) Point 3 12 1320 Point 4 4 480 The lab average would be:
((20.88 * 480) + (12 * 840) + (4 * 480)) / (480 + 840 + 480) = 12.24 - Example: Raw sample at end time
-
The point of this example is that if you have a raw sample on the interval end time then it is ignored because of the time weighting.
Copy and paste these lines into an empty CSV file and import the file with the File collector.
[Tags]
Tagname,DataType,HiEngineeringUnits,LoEngineeringUnits,StepValue
TAG5,SingleFloat,100,0,TRUE
[Data]
Tagname,TimeStamp,Value,DataQuality
TAG5,9/19/05 13:10:00.000,22,Good
TAG5,9/19/05 14:18:00.000,12,Good
TAG5,9/19/05 14:30:00.000,1,Good
Use the following query to retrieve the data using Average with a 30 minute interval.
select * from ihrawdata where tagname=tag5 and timestamp >
'9/19/05 14:00:00' and timestamp <= '9/19/05 14:30:00' and
calculationmode=average and intervalmilliseconds=30m
You will see the following results.
Time Stamp Value 14:30:0 18.00 See that the last raw sample is ignored
Point Value Duration (Seconds) Point 1 22.00 1080 (lab sampled at start) Point 3 12.00 720 Point 4 1.00 0 The lab sampled average is:
((22.00 * 1080) + (12 * 720) + (1 * 0)) / (1080 + 720) = 18.0- The interpolated average gives 13.59 because of the different interpolated value at interval start.
- The percent good is 100 since it was good the whole time.
- Example: No raw samples in interval
-
This case shows the biggest difference between averages of step value and non step value tags. In this case we lab sample a value at the start time and that is the average.
Copy and paste these lines into an empty CSV file and import the file with the File collector.
[Tags]
Tagname,DataType,HiEngineeringUnits,LoEngineeringUnits,StepValue
TAG4,SingleFloat,100,0,TRUE
[Data]
Tagname,TimeStamp,Value,DataQuality
TAG4,9/19/05 13:55:00.000,99,Good
TAG4,9/19/05 14:40:00.000,10,Good
Use the following query to retrieve the data using Average.
select * from ihrawdata where tagname=tag4 and timestamp >
'9/19/05 14:00:00' and timestamp <= '9/19/05 14:30:00' and
calculationmode=average and intervalmilliseconds=30m
You will see the following results.
Time Stamp Value Quality 14:30:00 99 100 Note: The single lab sampled value at interval start time is the average.Retrieving the data when StepVa
lue=FALSEgives the following:Time Stamp Value Quality 14:30:00 89.11 100 Note: The single interpolated sample at interval start time is the average of the interval.
Comment Retrieval Mode
The Comment Retrieval Mode returns any comments or annotations that have been stored with the data between the start time and end time of the query.
However, some Sampling and Calculation modes use raw samples beyond the start and end time to interpolate a value. An average will interpolate a value at the start of each interval and this will likely use raw samples outside the interval.
To retrieve the comments from raw values that were used beyond the interval, you can define a registry key on a computer running the Data Archiver.
Create a DWORD value under:
HKEY_LOCAL_MACHINE\Software\Intellution, Inc.\iHistorian\Services\DataArchiver- If you have the Data Archiver installed, the registry key should already exist and you are just adding a DWORD value.
- Set
CommentRetrievalModeto 1.
- You do not have to restart the Archiver for the changes to the registry to take place. The changes to registry setting take effect immediately
- Raw data queries are not affected with this change.
- Any application can be used to query the data
- The Comment Retrieval Mode may result in many comments being returned for a query. Therefore, it is not recommended for users who want to plot the data via the Proficy Real Time Information Portal (RTIP) Chart as it may cause slower performance.
Query Modifiers
- ONLYGOOD
The ONLYGOOD modifier excludes bad and uncertain data quality values from retrieval and calculations. Use this modifier with any sampling or calculation mode but it is most useful with Raw and CurrentValue queries.
All the calculation modes such as minimum or average exclude bad values by default, so this modifier is not required with those.
- Example 1:Demonstrating the Behavior
-
Import the following data to demonstrate the behavior of ONLYGOOD
[Tags] Tagname,DataType,HiEngineeringUnits,LoEngineeringUnits BADDQTAG,SingleFloat,60,0 [Data] Tagname,TimeStamp,Value, DataQuality BADDQTAG,12-Jul-2012 8:59:00.000,22.7,Good BADDQTAG,12-Jul-2012 9:08:00.000,12.5,Bad BADDQTAG,12-Jul-2012 9:14:00.000,7.0,Bad BADDQTAG,12-Jul-2012 9:22:00.000,4.8,Good - Example 2: Excluding bad data from raw data query
-
Without any query modifier, all raw samples are returned from a RawByTime query.
select timestamp,value,quality
from ihrawdata
where tagname = BADDQTAG and samplingmode=Rawbytime and timestamp < now
Time Stamp Value Quality 7/12/2012 08:59:00 22.7000000 Good, NonSpecific 7/12/201209:08:00 12.5000000 Bad, NonSpecific 7/12/201209:14:00 7.0000000 Bad, NonSpecific 7/12/201209:22:00 4.8000000 Good, NonSpecific Note: The above results have both good and bad samples:Now by using the ONLYGOOD modifier, you can exclude the bad quality values:
select timestamp,value,quality
from ihrawdata
where tagname = BADDQTAG and samplingmode=Rawbytime and timestamp < now and criteriastring="#ONLYGOOD"
timestamp             value              quality
Time Stamp Value Quality 7/12/2012 08:59:00 22.7000000 Good, NonSpecific 7/12/201209:22:00 4.8000000 Good, NonSpecific Note: Only the good samples have been retrieved. - Example 3: Retrieving the last known value
-
- Value
You can use the ONLYGOOD query modifier to show the last known good value for a tag. If the collector loses communication with the data source or has shut down, you can ignore the bad data that is logged.
The following examples demonstrate the ways to retrieve the last known values:
[Tags]
Tagname,DataType,HiEngineeringUnits,LoEngineeringUnit
CURRENTLYBAD,SingleInteger,60,0
[Data]
Tagname,TimeStamp,Value,DataQuality
CURRENTLYBAD,06-Aug-2012 8:59:00.000,2,Good
CURRENTLYBAD,06-Aug-2012 9:02:00.000,0,Bad
Without any query modifier, the newest raw sample is returned in a current value query as retrieved with the following query.
select timestamp,value,quality
from ihrawdata
where tagname = CURRENTLYBAD and samplingmode=CurrentValue
Time Stamp Value Quality 8/6/201209:02:00 Bad NonSpecific The bad data could be a communication error or collector shutdown marker
When the ONLYGOOD modifier is used, the bad quality value is ignored and last known good value is returned as per the query here.
where tagname = CURRENTLYBAD and samplingmode=CurrentValue and criteriastring="#ONLYGOOD"select timestamp,value,quality from ihrawdataNote: only the Good value has been retrieved as following. timestamp value quality.Time Stamp Value Quality 8/6/201208:59:00 2 Good NonSpecific - Anticipated Usage
-
You can use the ONLYGOOD modifier to exclude end of collection markers but understand that it excludes all bad data, even communication errors, and out of range errors.
If you want to bring data into Microsoft Excel for further analysis, you can use ONLYGOOD so that good values are brought into a spreadsheet.
- INCLUDEREPLACED
Normally, when you query raw data from Historian, any values that have been replaced with a different value for the same timestamp are not returned. The INCLUDEREPLACED modifier helps you to indicate that you want replaced values to be returned, in addition to the currently retrievable data. However, you cannot query only the replaced data and the retrievable values that have replaced. You can query all currently visible data and get the data that has been replaced.
This modifier is only useful with rawbytime or rawbynumber retrieval. Do not use it with any other sampling or calculation mode.
- Example
-
Import this data to demonstrate the behavior of the INCLUDEDELETED query modifier.
[Tags] Tagname,DataType,HiEngineeringUnits,LoEngineeringUnits DELETEDDATA,SingleInteger,60,0 [Data] Tagname,TimeStamp,Value,DataQuality DELETEDDATA,06-Aug-2012 9:01:00.000,1,Good DELETEDDATA,06-Aug-2012 9:02:00.000,2,Good DELETEDDATA,06-Aug-2012 9:04:00.000,4,GoodDelete the raw sample at 9:02 and query the raw data without any modifier and you will get only the non-deleted values.
Run the following query:
select timestamp,value,quality
from ihrawdata
where tagname = DELETEDDATA and samplingmode=RawByTime and timestamp < nowTime Stamp Value Quality 8/6/2012 09:01:00 1 Good NonSpecific 8/6/2012 09:04:00 4 Good NonSpecific Query with the INCLUDEDELETED modifier and you will get the deleted sample together with the non-deleted data.
select timestamp,value,quality from ihrawdata where tagname = DELETEDDATA and samplingmode=RawByTime and timestamp < now and criteriastring="#INCLUDEDELETED"Time Stamp Value Quality 8/6/2012 09:01:00 1 Good NonSpecific 8/6/2012 09:02:00 2 Good NonSpecific 8/6/2012 09:04:00 4 Good NonSpecific - Anticipated Usage
-
The INCLUDEDELETED modifier can be used to detect and recover deleted data. Perform a query without the modifier and with the modifier and compare the results. You will detect the deleted samples. You can also determine the deleted samples with a User API program.
ONLYIFCONNECTED and ONLYIFUPTODATE
The ONLYIFCONNECTED and ONLYIFUPTODATE modifiers can be used on any sampling or calculation mode to retrieve bad data if the collector is not currently connected and sending data to the archiver. The bad data is not stored in the IHA file but is only returned in the query. If the collector reconnects and flushes data and you run the query again, the actual stored data is returned in the following situations:
- Collector loses connection to the Archiver
- Collector crashes
- Collector compression is used and no value exceeds the deadband
Any data query will return the last known value repeated till the current time with the quality of data as good. But the information could have changed in the real world and has yet to reach the archiver.
Repeating the last known good value data can be misleading. Data should be returned as bad quality if no data is coming in from a collector.
The Data Archiver keeps track of the newest raw sample received for any tag for each collector. If no data is received for any tag, the collector is considered to be idle. If the collector is idle for more than 270 seconds, then either the data is heavily compressed or the collector is crashed or has lost connection. The collector idle time defaults to 270 seconds and this current setting appears in the dataarchiver.shw file. You can change the value using an SDK program. The setting applies to all collectors.
Use the ONLYIFUPTODATE modifier to return bad data from the time of the newest raw sample to the current time. However, if there is an unlikely chance that all tags are heavily compressed, then use the ONLYIFCONNECTED modifier. The difference in the behavior of the two modifiers is given in the following examples:
When you add an ONLYIFCONNECTED or ONLYIFUPTODATE modifier to the query, and the collector is disconnected from the archiver, bad values are returned from the time of the disconnect until the current time. Queries of data before the disconnect time are unaffected.
- The ONLYIFCONNECTED and ONLYIFUPTODATE modifiers are applicable to tags that are collected by data collectors.
- For raw by number, if the number of samples collected are greater or equal to the number of samples, bad data quality is not added.
- For raw by time, if the endtime is less than maximum data received time, bad data quality is not added.
- For raw by number backward, bad data quality is added at the beginning.
- Example 1: Using ONLYIFCONNECTED to detect connection loss
-
To demonstrate the behavior of ONLYIFCONNECTED, you need to query data currently being collected.
- Configure the Simulation collector to collect any tag once per second with no compression. For example, collect the simulation RAMP tag.
- Let the collector run for at least 5 minutes of collection.
- Disconnect the collector but leave it running. In this test, the collector was disconnected at 20:55:00.
- After about 5 minutes, query the data without ONLYIFCONNECTED and the
last known value repeated with good quality to the current time, even
though the collector is not connected.
set starttime='22-Aug-2012 20:53:00',endtime='now
select timestamp,value,quality
from ihrawdata
where tagname = RAMP and samplingmode=Interpolated and intervalmilliseconds=5s order by timestamp asc
Time Stamp Value Quality 8/22/2012 20:54:55 166.666666666667 100.0000000 8/22/2012 20:55:00 0.000000000000 100.0000000 8/22/2012 20:55:05 166.666666666667 100.0000000 8/22/2012 20:55:10 333.333333333333 100.0000000 8/22/2012 20:55:15 500.000000000000 100.0000000 8/22/2012 20:55:20 533.333333333333 100.0000000 8/22/2012 20:55:25 533.333333333333 100.0000000 8/22/2012 20:55:30 533.333333333333 100.0000000 8/22/2012 20:55:35 533.333333333333 100.0000000 - Run the query again with ONLYIFCONNECTED and the data is marked bad at
the time of the collector
disconnect:
set starttime='22-Aug-2012 20:53:00',endtime='now
select timestamp,value,quality
from ihrawdata
where tagname = RAMP and samplingmode=Interpolated and intervalmilliseconds=5s and criteriastring=#onlyifconnect
Time Stamp Value Quality 8/22/2012 20:54:55 166.666666666667 100.0000000 8/22/2012 20:55:00 0.000000000000 100.0000000 8/22/2012 20:55:05 166.666666666667 100.0000000 8/22/2012 20:55:10 333.333333333333 100.0000000 8/22/2012 20:55:15 500.000000000000 100.0000000 8/22/2012 20:55:20 0.000000000000 0.0000000 8/22/2012 20:55:25 0.000000000000 0.0000000 8/22/2012 20:55:30 0.000000000000 0.0000000 8/22/2012 20:55:35 0.000000000000 0.0000000 - Reconnect the collector and once the collector reconnects and flushes
its buffered data run the query again with ONLYIFCONNECTED and the
period of bad data is filled in with ramping values:
Time Stamp Value Quality 8/22/2012 20:54:55 166.666666666667 100.0000000 8/22/2012 20:55:00 0.000000000000 100.0000000 8/22/2012 20:55:05 166.666666666667 100.0000000 8/22/2012 20:55:10 333.333333333333 100.0000000 8/22/2012 20:55:15 500.000000000000 100.0000000 8/22/2012 20:55:20 569.696969985962 100.0000000 8/22/2012 20:55:25 615.151515960693 100.0000000 8/22/2012 20:55:30 660.606061935425 100.0000000 8/22/2012 20:55:35 706.060606002808 100.0000000
- Example 2: Querying Compressed Data
-
If all tags for a collector are compressed, then the newest raw sample across all tags can easily be older than 270 seconds even when the collector is connected to archiver. It is unlikely in a real system that a collector will send 0 raw samples for 270 seconds, but it is possible.
- Use the simulation collector and collect the constant tag as 1 second polled with a small deadband such as 1. In the example below, the newest raw sample is at 17:27:31 and the current time is 5 minutes or more.
- Query the data as interpolated with a 5 second interval and no modifier.
set starttime='23-Aug-2012 17:00:30',endtime='now,rowcount=0
select timestamp,value,quality
from ihrawdata
where tagname = CONSTANT and samplingmode=Interpolated and intervalmilliseconds=5s order by timestamp asc
Time Stamp Value Quality 8/23/20121 7:27:20 500.000000000000 100.0000000 8/23/20121 7:27:25 500.000000000000 100.0000000 8/23/20121 7:27:30 500.000000000000 100.0000000 8/23/20121 7:27:35 0.000000000000 100.0000000 8/23/20121 7:27:40 0.000000000000 100.0000000 Note: The newest sample is repeated to the current time - Query with ONLYIFCONNECTED and you get the same results even when the
newest raw sample is more than 270 seconds old. The data is old but the
collector is currently connected.
set starttime='23-Aug-2012 17:00:30',endtime='now,rowcount=0
select timestamp,value,quality
from ihrawdata
where tagname = CONSTANT and samplingmode=Interpolated and intervalmilliseconds=5s and criteriastring=#onlyifcon
Time Stamp Value Quality 8/23/20121 7:27:20 500.000000000000 100.0000000 8/23/20121 7:27:25 500.000000000000 100.0000000 8/23/20121 7:27:30 500.000000000000 100.0000000 8/23/20121 7:27:35 500.000000000000 100.0000000 8/23/20121 7:27:40 500.000000000000 100.0000000 - Query with ONLYIUPTODATE and the data is considered bad quality after
the newest raw
sample.
set starttime='23-Aug-2012 17:00:30',endtime='now,rowcount=0
select timestamp,value,quality
from ihrawdata
where tagname = CONSTANT and samplingmode=Interpolated and intervalmilliseconds=5s and criteriastring=#onlyifupt
Time Stamp Value Quality 8/23/20121 7:27:20 500.000000000000 100.0000000 8/23/20121 7:27:25 500.000000000000 100.0000000 8/23/20121 7:27:30 500.000000000000 100.0000000 8/23/20121 7:27:35 0.000000000000 0.0000000 8/23/20121 7:27:40 0.000000000000 0.0000000
Note: If your collector can possibly have no data for any tag due to compression, use ONLYIFCONNECTED. Otherwise, if you want to detect data being old due to collector crash or disconnect, then use ONLYIFUPTODATE and optionally adjust the collector idle time. - Anticipated Usage
-
Use the ONLYIFCONNECTED and ONLYIFUPTODATE modifiers so that your trend lines stop plotting when the collector loses connection.
Use the ONLYIFCONNECTED and ONLYIFUPTODATE modifiers with CurrentValue retrieval so that the current value turns to bad quality if the collector is disconnected. This way you are not misled by looking at an outdated value that does not match the real world.
ONLYRAW
The ONLYRAW modifier retrieves only the raw stored samples. It does not add interpolated or lab sampled values at the beginning of each interval during calculated retrieval such as average or minimum or maximum.
Normally, a data query for minimum value will interpolate a value at the start of each interval and use that together with any raw samples to determine the minimum value in the interval. Interpolation is necessary because some intervals may not have any raw samples stored.
- Example
-
Import this data to demonstrate the behavior of the ONLYRAW query modifier.
[Tags]
Tagname,DataType,HiEngineeringUnits,LoEngineeringUnits
RAMPUP,SingleFloat,100,0
[Data]
Tagname,TimeStamp,Value,DataQuality
RAMPUP,06-Aug-2012 9:01:00.000,1,Good
RAMPUP,06-Aug-2012 9:02:00.000,2,Good
RAMPUP,06-Aug-2012 9:03:00.000,3,Good
RAMPUP,06-Aug-2012 9:04:00.000,4,Good
RAMPUP,06-Aug-2012 9:05:00.000,5,Good
RAMPUP,06-Aug-2012 9:06:00.000,6,Good
When you query the minimum without any modifier, you see that the minimum value may not be one of the stored values.
set starttime='06-Aug-2012 09:02:30',endtime='06-Aug-2012 09:05:30'
select timestamp,value,quality
from ihrawdata
where tagname = RAMPUP and samplingmode=Calculated and CalculationMode=minimum and numberofsamples=3
Time Stamp Value Quality 8/6/2012 09:03:30 2.500000000000 100.0000000 8/6/2012 09:04:30 3.500000000000 100.0000000 8/6/2012 09:05:30 4,500000000000 100.0000000 set starttime='06-Aug-2012 09:02:30',endtime='06-Aug-2012 09:05:30' select timestamp,value,quality from ihrawdata where tagname = RAMPUP and samplingmode=Calculated and CalculationMode=minimum and numberofsamples=3 and criteriastring='#onlyraw'Time Stamp Value Quality 8/6/2012 09:03:30 3.000000000000 100.0000000 8/6/2012 09:04:30 4.000000000000 100.0000000 8/6/2012 09:05:30 5.000000000000 100.0000000 - Anticipated Usage
-
Use the ONLYRAW modifier to query the minimum and maximum values of stored data samples, similar to the RawAverage Calculation mode. A minimum or maximum of raw samples is more like doing a MIN() or MAX () in an Excel spreadsheet. Realize that if you use the ONLYRAW modifier, there may be intervals with no raw samples. The ONLYRAW modifier is useful for Calculation modes and not the Sampling modes.
LABSAMPLING
The LABSAMPLING modifier affects the calculation modes that interpolate a value at the start of each interval. Instead of using interpolation, lab sampling is used. When querying highly compressed data you may have intervals with no raw samples stored. An average from 2 P.M to 6 P.M on a one hour interval will interpolate a value at 2 P.M., 3 P.M., 4 P.M, and 5 P.M and use those in addition to any stored samples to compute averages. When you specify LABSAMPLING, then lab sampling mode is used instead of interpolated sampling mode to determine the 2 P.M., 3 P.M., 4 P.M., and 5 P.M., values.
A lab sampled average would be used when querying a tag that never ramps but changes in a step pattern such as a state value or setpoint.
- Example
Import this data to demonstrate the behavior of the LABSAMPLING query modifier.
[Tags]
Tagname,DataType,HiEngineeringUnits,LoEngineeringUnits
RAMPUP,SingleFloat,100,0
[Data]
Tagname,TimeStamp, Value,DataQuality
RAMPUP,06-Aug-2012 9:01:00.000,1,Good
RAMPUP,06-Aug-2012 9:02:00.000,2,Good
RAMPUP,06-Aug-2012 9:03:00.000,3,Good
RAMPUP,06-Aug-2012 9:04:00.000,4,Good
RAMPUP,06-Aug-2012 9:05:00.000,5,Good
RAMPUP,06-Aug-2012 9:06:00.000,6,Good
Run this query without a modifier to see the minimum values using the interpolated values:
set starttime='06-Aug-2012 09:02:30',endtime='06-Aug-2012 09:05:30'
select timestamp,value,quality
from ihrawdata
where tagname = RAMPUP and samplingmode=Calculated and CalculationMode=minimum and numberofsamples=3
The returned minimum values are stored values but sampled forward to each interval timestamp. This is the behavior of lab sampling and is applied here to calculated values.Time Stamp Value Quality 8/6/2012 09:03:30 2.500000000000 100.0000000 8/6/2012 09:04:30 3.500000000000 100.0000000 8/6/2012 09:05:30 4.500000000000 100.0000000 - Anticipated Usage
-
Use the LABSAMPLING modifier to query the minimum, maximum, and average values of tags that change in a step fashion and never ramp. For example, you may want to retrieve the minimum of a set point. This tag would change from one value directly to another without ramping. And the value may not change in a long period. A minimum should not return a value that ramps over a long period of time from one set point value to the next. The LABSAMPLING modifier is useful for Calculation modes and not the Sampling modes.
ENUMNATIVEVALUE
The ENUMNATIVEVALUE modifier retrieves the native, numeric values such as 1 or 2 instead of string values such as on/off for the data that has enumerated states associated with it.
- Example
-
Import this data to demonstrate the use of ENUMNATIVEVALUE:
[Tags]
Tagname,DataType,HiEngineeringUnits,LoEngineeringUnits
STATETAG,SingleInteger,60,0
[Data]
Tagname,TimeStamp,Value,DataQuality
STATETAG,06-Aug-2012 9:08:00.000,4,Good
STATETAG,06-Aug-2012 9:14:00.000,4,Good
STATETAG,06-Aug-2012 9:22:00.000,2,Good
Assume the tag has an enumerated set associated where 2=Stopped and 4=Running. When you do the interpolated query you get the string value:
set starttime='06-Aug-2012 09:10:00',endtime='06-Aug-2012 09:30:00'
select timestamp,value,quality
from ihrawdata
where tagname = STATETAG and samplingmode=Interpolated and numberofsamples=6
Time Stamp Value Quality 8/6/2012 09:13:20 running 100.0000000 8/6/2012 09:16:40 running 100.0000000 8/6/2012 09:20:00 running 100.0000000 8/6/2012 09:23:20 stopped 100.0000000 8/6/2012 09:26:40 stopped 100.0000000 8/6/2012 09:30:00 stopped 100.0000000 Using the ENUMNATIVEVALUE query modifier, you can get the numeric value suitable for plotting
set starttime='06-Aug-2012 09:10:00',endtime='06-Aug-2012 09:30:00'
select timestamp,value,quality
from ihrawdata
where tagname = STATETAG and samplingmode=Interpolated and numberofsamples=6 and criteriastring='#enumnativevalue'
Time Stamp Value Quality 8/6/2012 09:13:20 4 100.0000000 8/6/2012 09:16:40 4 100.0000000 8/6/2012 09:20:00 4 100.0000000 8/6/2012 09:23:20 2 100.0000000 8/6/2012 09:26:40 2 100.0000000 8/6/2012 09:30:00 2 100.0000000 Note: For bad data, the values are returned as string values based on the Enumerated State table though the enumerative value is set to FALSE. - Anticipated Usage
-
Use the ENUMNATIVEVALUE query modifier to plot tags that use enumerated values. You can put the string value in a data link and put the native value in a chart.
INCLUDEBAD
The INCLUDEBAD modifier directs the Data Archiver to consider raw samples of bad data quality when computing calculation modes. Use INCLUDEBAD modifier to consider both good and bad quality values.
You can use the INCLUDEBAD modifier with any Sampling or Calculation mode only if you want to include bad quality data.
Use the INCLUDEBAD modifier only if you believe the bad quality data has meaningful values and are useful as input to calculations. Most bad data quality values do not have meaningful values; they show 0 or unpredictable numbers. But in some cases, if the data is being written using a user program instead of a collector, you can use this query modifier.
Bad data always has a sub quality such as Comm Error or Configuration Error. When you use the INCLUDEBAD modifier any end of collection raw samples or calculation error raw samples are still ignored because they are not process data, just data markers that are inserted by collectors.
- Example
-
Import this data to demonstrate the behavior of the INCLUDEBAD query modifier:
[Tags]
Tagname,DataType,HiEngineeringUnits,LoEngineeringUnits
Tag1,SingleFloat,60,0
[Data]
Tagname,TimeStamp,Value,DataQuality
Tag1,07-05-2011 17:24:00,29.72,Bad
Tag1,07-05-2011 17:25:00,29.6,Good
Tag1,07-05-2011 17:26:00,29.55,Good
Tag1,07-05-2011 17:27:00,29.49,Bad
Tag1,07-05-2011 17:28:00,29.53,Bad
Note: The given sample contains three bad quality data.Run the following query
set starttime='07-05-2011 16:00:00', endtime='07-05-2011 21:00:00'
select timestamp,value,quality from ihrawdata where tagname like 'Tag1' and samplingMode=calculated and
 CalculationMode=count and Numberofsamples=1
Time Stamp Value Quality 7/5/201121:00:00 2.000000000000 100.0000000 The count is 2 because only good quality data is considered. If you want to consider bad quality use the INLCUDEBAD query modifier as given in the following example.
set starttime='07-05-2011 16:00:00', endtime='07-05-2011 21:00:00'
select timestamp,value,quality from ihrawdata where tagname like 'Tag1' and samplingMode=calculated and
CalculationMode=count and criteriastring="#INCLUDEBAD" and  Numberofsamples=1
Time Stamp Value Quality 7/5/201121:00:00 5.000000000000 100.0000000 Note: When we use INCLUDEBAD query modifier all the values are considered and the count is 5. - Anticipated Usage
-
The INCLUDEBAD modifier can be used to force the Data Archiver to consider every raw sample collected from a field device while still excluding Proficy Historian collection markers or calculation errors and timeouts.
The INCLUDEBAD modifier is usually used if you are writing data with a custom program and not a collector and your program stores meaningful values with bad quality.
FILTERINCLUDEBAD
The FILTERINCLUDEBAD modifier directs the Data Archiver to consider the values of bad quality data when determining the time ranges that match the filter condition. This modifier is similar to the INCLUDEBAD but that modifier applies to the data tag and this modifier applies to the FilterTag.
You can use the FILTERINCLUDEBAD modifier if you are also using INCLUDEBAD because your application data of bad quality has meaningful values then you can also consider this modifier but, you do not need to use both modifiers at the same time.
- Example: Filtered Data Query containing Bad Quality Filter Values
-
Import this data to demonstrate the behavior of the FILTERINCLUDEBAD query modifier:
[Tags]
Tagname,DataType,HiEngineeringUnits,LoEngineeringUnits
ExcelTag1,SingleFloat,60,0
[Data]
Tagname,TimeStamp,Value,DataQuality
ExcelTag1,07-05-2011 17:24:00,29.72,Bad
ExcelTag1,07-05-2011 17:25:00,29.6,Good
ExcelTag1,07-05-2011 17:26:00,29.55,Good
ExcelTag1,07-05-2011 17:27:00,29.49,Bad
ExcelTag1,07-05-2011 17:28:00,29.53,Bad
The given sample contains three bad quality data samples. Run the following query:
set starttime='07-05-2011 16:00:00', endtime='07-05-2011 21:00:00'
select timestamp,value,quality from ihrawdata where tagname=ExcelTag1 and samplingMode=Calculated and
calculationmode=rawtotal and FilterExpression ='ExcelTag1>29.5' and numberofsamples=1
In this query, we use a filtered expression where the filter condition is ExcelTag1>29.5, and the result is as follows because it adds the two good values to compute the RawTotal:
Time Stamp Value Quality 7/5/201121:00:00 59.149999618530 100.0000000 Bad quality data is not considered while filtering. If you want to consider bad quality data then use the FILTERINLCUDEBAD query modifier together with the INCLUDEBAD query modifier as in the following query:
set starttime='07-05-2011 16:00:00', endtime='07-05-2011 21:00:00'
select timestamp,value,quality from ihrawdata where tagname=ExcelTag1 and samplingMode=Calculated and
calculationmode=rawtotal and FilterExpression ='ExcelTag1>29.5' and numberofsamples=1 and CriteriaString='#FilterIncludeBad#IncludeBad'
The result is as follows
Time Stamp Value Quality 7/5/201121:00:00 118.399999618530 100.0000000 Note: The value is 118 because all the values that are greater than 29.5 are added together, not just the good quality values. - Anticipated Usage
-
The FILTERINCLUDEBAD modifier can be used to force the Data Archiver to consider every raw sample collected from a field device when determining the time ranges while still excluding Historian injected end of collection markers or calculation errors and timeouts.
USEMASTERFIELDTIME
The USEMASTERFIELDTIME query modifier is used only for the MultiField tags. It returns the value of all the fields at the same timestamp of the master field time, in each interval returned.
- In your user defined data type, you have to indicate which field is the master field. You can define a master field when you define the type.
- When you use the USEMASTERFIELDTIME query modifier, the query returns raw values of all the field elements at the timestamp determined by the MasterField.
- When you use the USEMASTERFIELDTIME query modifier in Excel Add-in, the percentage good value displayed will be incorrect. It is recommended to use this query modifier using APIs.
- Only a few calculation modes are supported by the USEMASTERFIELDTIME query
modifier. The supported calculation modes are:
- Minimum Value
- Maximum Value
- Minimum Time
- Maximum Time
- FirstRawValue
- FirstRawTime
- LastRawValue
- LastRawTime
The supported modes will examine the raw samples for the master field of a Multi Field tag. For each raw sample in the interval, the minimum or maximum or first or last sample is determined depending on the mode. The timestamp of that raw sample is the master field time.
mytag with 3 fields and
field3 is the master field. - You do a LastRawValue query on
mytagand pass the USEMASTERFIELDTIME query modifier. - The Data Archiver determines the last raw sample for mytag.field3 between 3pm and 4pm is at 3:42pm. That is the master field time for this interval. Each interval has a master field time.
- The Data Archiver gets the values for field1 and field2 at 3:42 so now you have a value for all 3 fields at 3:42.
- Example
-
Import this data to demonstrate the behavior of the USEMASTERFIELDTIME query modifier.
[Data]
Tagname,TimeStamp,Value,DataQuality
MUser1.F1,05-22-2013 14:15:00,4,Good
MUser1.F1,05-22-2013 14:15:01,7,Good
MUser1.F1,05-22-2013 14:15:02,9,Good
MUser1.F2,05-22-2013 14:15:00,241,Good
MUser1.F2,05-22-2013 14:15:01,171,Good
MUser1.F2,05-22-2013 14:15:02,191,Good
Note: In this sample the MUser1 tag has two fields F1 and F2 and F2 is marked as the MasterField.Run the following query:set starttime = '5/22/2013 14:15:00', endtime = '5/22/2013 14:15:02' select tagname, timestamp, value, quality from ihrawdata where tagname = 'MUser1' and samplingmode = calculated and calculationmode = minimum and criteriastring = '#USEMASTERFIELDTIME' and numberofsamples = 1The output is as follows:Tag Name Time Stamp Value Quality MUser1.F1 05-22-201314:15:02 7 0.0000000 MUser1.F2 05-22-201314:15:02 171.000000000000 100.0000000 Here the minimum value for the Master Field tag F2 is 171 at 14:15:01 timestamp. That is the master time. Then the master time is used to get the value of F1 at the same timestamp which is 7 and this is returned even as the minimum value of F1 is 4.
In a multi field tag it is possible that some fields may be NULL at a given timestamp. In this case if F1 was a NULL value at 14:15:01 you would get a value of null and bad quality.
HONORENDTIME
Normally, a query keeps searching through archives until the desired number of samples has been located, or until it gets to the first or last archive. However, there are cases where you would want to specify a time limit as well. For example, you may want to output the returned data for a RawByNumber query in a trend page, in which case there is no need to return data that would be off page.
- Example using HONORENDTIME with RawByNumber Sampling Mode
-
Import this data to Historian:
[Tags] Tagname,DataType,HiEngineeringUnits,LoEngineeringUnits TAG1,SingleInteger,60,0 [Data] Tagname,TimeStamp,Value,DataQuality TAG1,09/18/2015 14:00:00.000,00,Good TAG1,09/18/2015 14:05:00.000,5,Good TAG1,09/18/2015 14:10:00.000,10,Good TAG1,09/18/2015 14:15:00.000,15,Good TAG1,09/18/2015 14:20:00.000,20,Good TAG1,09/18/2015 14:25:00.000,25,Good TAG1,09/18/2015 14:30:00.000,30,Good TAG1,09/18/2015 14:35:00.000,35,Good TAG1,09/18/2015 14:40:00.000,40,Good TAG1,09/18/2015 14:45:00.000,45,Good TAG1,09/18/2015 14:50:00.000,50,Good TAG1,09/18/2015 14:55:00.000,55,Good TAG1,09/18/2015 15:00:00.000,60,Good- Without HONORENDTIME Query Modifier
-
set starttime='9/18/2015 14:00:00',endtime='9/18/2015 14:15:00'
select Timestamp,Value,Quality from ihrawdata where tagname like TAG1 and samplingmode=rawbynumber and
direction=forwardand numberofsamples=6
The output is as follows:
Time Stamp Value Quality 9/18/2015 14:00:00 0 Good NonSpecific 9/18/2015 14:05:00 5 Good NonSpecific 9/18/2015 14:10:00 10 Good NonSpecific 9/18/2015 14:15:0 15 Good NonSpecific 9/18/2015 14:20:00 20 Good NonSpecific 9/18/2015 14:25:00 25 Good NonSpecific In the above query, the endtime specified is ignored and 6 values are returned.
- With HONORENDTIME Query Modifier
-
set starttime='9/18/2015 14:00:00',endtime='9/18/2015 14:15:00'
select TagName,Timestamp,Value,Quality from ihrawdata where tagname like TAG1 and samplingmode=rawbynumber and
direction=forward and numberofsamples=6 and criteriastring=#honorendtime
The output is as follows:
Time Stamp Value Quality 9/18/2015 14:00:00 0 Good NonSpecific 9/18/2015 14:05:00 5 Good NonSpecific 9/18/2015 14:10:00 10 Good NonSpecific 9/18/2015 14:15:0 15 Good NonSpecific In the above query, the endtime specified is used and only 4 values are returned.
- Anticipated Usage
-
Use the HONORENDTIME modifier when you would want to specify a time limit to a query. For example, you may want to output the returned data for a RawByNumber query in a trend page, in which case there is no need to return data that would be offpage.
EXAMINEFEW
Queries using calculation modes normally loop through every raw sample, between the given start time and end time, to compute the calculated values.
- Examples using EXAMINEFEW with FirstRawValue and FirstRawTime Calculation Modes
-
Import this data to Historian:
[Tags] Tagname,DataType,HiEngineeringUnits,LoEngineeringUnits Tag1,SingleFloat,60,0 [Data] Tagname,TimeStamp,Value,DataQuality Tag1,07-05-2011 17:24:00,29.72,Bad Tag1,07-05-2011 17:25:00,29.6,Good Tag1,07-05-2011 17:26:00,29.55,Good Tag1,07-05-2011 17:27:00,29.49,Bad Tag1,07-05-2011 17:28:00,29.53,Bad Tag1,07-05-2011 17:29:00,29.58,Good Tag1,07-05-2011 17:30:00,29.61,Bad Tag1,07-05-2011 17:31:00,29.63,Bad Tag1,07-05-2011 18:19:00,30,Good Tag1,07-05-2011 18:20:00,29.96,Good Tag1,07-05-2011 18:21:00,29.89,Good Tag1,07-05-2011 18:22:00,29.84,Good Tag1,07-05-2011 18:23:00,29.81,Bad- Using FirstRawValue Calculation Mode
-
set starttime='07-05-2011 16:00:00', endtime='07-05-2011 19:00:00'
select timestamp,value,quality from ihrawdata where tagname like 'Tag1' and samplingMode=Calculated and
CalculationMode=FirstRawValue and criteriastring="#EXAMINEFEW" and intervalmilliseconds=1h
The output is as follows:
Time Stamp Value Quality 07-05-2011 17:00:00 00.0000000 0.0000000 07-05-2011 18:00:00 29.6000000 100.0000000 07-05-2011 19:00:00 30.0 100.0000000 Note: The EXAMINEFEW query modifier does not affect query results, but may improve read performance. - Using FirstRawTime Calculation Mode
-
set starttime='07-05-2011 16:00:00', endtime='07-05-2011 19:00:00'
select timestamp,value,quality from ihrawdata where tagname like 'Tag1' and samplingMode=Calculated and
CalculationMode=FirstRawTime and criteriastring="#EXAMINEFEW" and intervalmilliseconds=1h
The output is as follows:
Time Stamp Value Quality 07-05-2011 17:00:00 01-01-1970 05:30:00 0.0000000 07-05-2011 18:00:00 07-05-2011 17:25:00 100.0000000 07-05-2011 19:00:00 07-05-2011 18:20:00 100.0000000 Note: The EXAMINEFEW query modifier does not affect query results, but may improve read performance.
- Anticipated Usage
-
Using the EXAMINEFEW modifier is recommended when:
- The time interval is greater than 1 minute.
- The collection interval is greater than 1 second.
- The data node size is greater than the default 1400 bytes.
- The data type of the tags is String or Blob.
Note: Query performance varies depending on all of the above factors.
EXCLUDESTALE
Stale tags are tags that have no new data samples within a specified period of time, and which have the potential to add to system overhead and slow down user queries.
The EXCLUDESTALE query modifier allows for exclusion of stale tags in data queries.
- Example
-
- Data
-
In this example, the data below is for the last raw samples for Tag1 to Tag7:
Tag, Timestamp, Value Tag1, 9/25/2015 10:00:00, 10 Tag2, 9/18/2015 10:00:00, 20 Tag3, 9/25/2015 10:00:00, 30 Tag4, 9/25/2015 10:00:00, 40 Tag5, 9/18/2015 10:00:00, 50Tag6, 9/25/2015 10:00:00, 60 Tag7, 9/18/2015 10:00:00, 70 - Further Assumptions
-
- Current System Time: 9/26/2015 11:00:00
- Server configuration
- Stale Period: 7 Days
- Stale Period Check: 1 Day
In this case, Tag2, Tag5, and Tag7 were logged more than 7 days ago. They are therefore considered stale.
- Query without EXCLUDESTALE
-
The following query is run at 9/26/2015 11:00:00:
set StartTime='9/17/2015 10:00:00',EndTime='9/26/2015 11:00:00'
select TagName,Timestamp,Value from ihrawdata where tagname like Tag* and Samplingmode=RawByTime and
CriteriaString="#ExcludeStale"
Output is returned for the following tags:
Tag, Timestamp, Value
Tag1, 9/25/2015 10:00:00, 10
Tag3, 9/25/2015 10:00:00, 30
Tag4, 9/25/2015 10:00:00, 40
Tag6, 9/25/2015 10:00:00, 60
In the above query, the stale tags (Tag 2, Tag5, and Tag7) are excluded from the results.
- Query with EXCLUDESTALE:
-
The following query is run at 9/26/2015 11:00:00:
set StartTime='9/17/2015 10:00:00',EndTime='9/26/2015 11:00:00'
select TagName,Timestamp,Value from ihrawdata where tagname like Tag* and Samplingmode=RawByTime and
CriteriaString="#ExcludeStale"
Output is returned for the following tags:
Tag, Timestamp, Value
Tag1, 9/25/2015 10:00:00, 10
Tag3, 9/25/2015 10:00:00, 30
Tag4, 9/25/2015 10:00:00, 40
Tag6, 9/25/2015 10:00:00, 60
In the above query, the stale tags (Tag 2, Tag5, and Tag7) are excluded from the results.
- Anticipated Usage
-
Stale tags have the potential to add to system overhead and slow down user queries, without adding new data. The EXCLUDESTALE modifier can be used to exclude such tags, thereby speeding up query time.


