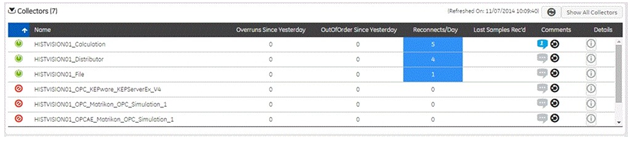
Collector Panel
The Collector panel in the Dashboard shows details of all the collectors whose performance does not meet the required performance status. The collector statistics panel displays data described in the following table. Click the Show All Collectors button to view all the collectors connected to the system. The View All Collectors page is displayed.
| Field | Description |
|---|---|
| Connection | Indicates the status of the current connection. "Running" (Green) indicates that the collector is operating. "Stopped" (Red) indicates that it is in pause mode and not collecting data. "Unknown" indicates that status information about the collector is unavailable at present, perhaps as a result of a lost connection between collector and server. |
| Name | The name of the computer the collector is running on. |
| Overruns Since Yesterday | The overruns in relation to the total events collected for the past 24 hours. This value is calculated by using the following equation: OVERRUN_PCT = OVERRUNS / ( OVERRUNS + TOTAL_EVENTS_COLLECTED ). Overruns are a count of the total number of data events not collected on their scheduled polling cycle. In normal operation, this value should be zero. You may be able to reduce the number of overruns on the collector by increasing the tag collection intervals (per tag). |
| Out of Order Since Yesterday | The number of samples within a series of timestamped data values normally transmitted in sequence have been received out of sequence for the past 24 hours. This field applies to all collectors. Even though events are still stored, a steadily increasing number of out of order events indicates a problem with data transmission that you should investigate. For instance, a steadily increasing number of out of order events when you are using the OPC Collector means that there is an out of order between OPC Server and the OPC Collector. This may also cause an out of order between the OPC Collector and the Data Archiver, but that is not what this statistic indicates. |
| Reconnects/Day | Displays the number of reconnections that happened in the last 24 hours. |
| Last Samples Received | Displays the delayed data sample duration. |
| Comments | Displays the comments if any. |
| Details | Click this button to view the Collector Detail Diagnostics |
Collector Detail
Selecting the Details option for a particular collector pops up a display that shows the current statistics on the operation of that selected data collector.
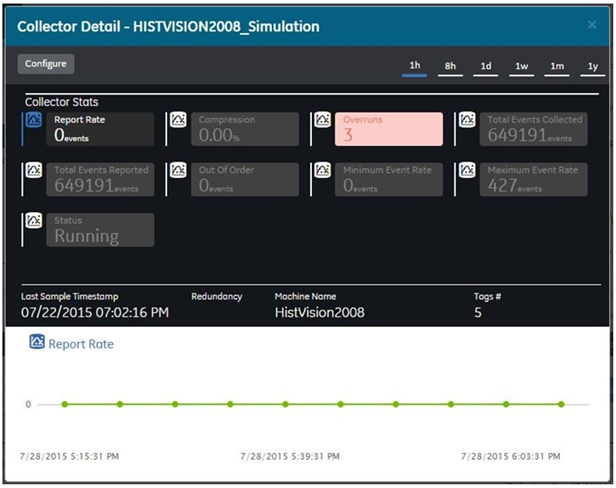
To view or modify the configuration details of the collector, click the Configure button. The statistics displayed on this screen are computed independently on various time scales and schedules. As a result, they may update at different times. You can choose the time scales by clicking on the time options provided on the top right area of the screen.
The collector detail diagnostics screen has the following types of fields.
- Trendable Fields
- These fields can be trended.
- These fields can be distinguished by the trend icon next to the field name.
- To graphically view a particular trendable field based on the timestamp, click on the field name.
- Non-Trendable Fields
- These fields cannot be trended.
- These fields have no trend icon next to the field name.
| Field | Description |
|---|---|
| Report Rate | This display is a trend chart that displays the average rate at which data is coming into the server from the selected collector. This is a general indicator of load on the Historian collector. Since this chart displays a slow trend of compressed data, it may not always match the instantaneous value of Report Rate displayed in the Collector panel of the System Statistics screen. |
| Compression | This display is a trend chart that displays the effectiveness of collector compression. If the chart displays a low current value, you can widen the compression deadbands to pass fewer values and increase the effect of compression. |
| Overruns Percent | This trend chart displays the value at which data overruns are occurring. This value is calculated by the following equation: OVERRUN_PCT =OVERRUNS / ( OVERRUNS + TOTAL_EVENTS_COLLECTED ) Overruns are a count of the total number of data events not collected. Under normal conditions, the current value should always be zero. If the current value is not zero, which indicates that data is being lost, you should take steps to reduce peak load on the system, by increasing the collection interval. |
| Total Events Collected | Counts the total number of events collected from the data source by the collector. |
| Total Events Reported | Counts the total number of events reported to the Historian archive from the collector. This number may not match the Total Events Collected field due to collector compression.. |
| Out of Order | The number of samples within a series of timestamped data values normally transmitted in sequence have been received out of sequence since collector startup. This field applies to all collectors. Even though events are still stored, a steadily increasing number of out of order events indicates a problem with data transmission that you should investigate. For instance, a steadily increasing number of out of order events when you are using the OPC Collector means that there is an out of order between the OPC Server and the OPC Collector. This may also cause an out of order between the OPC Collector and the data archiver but that is not what this statistic indicates. |
| Minimum Event Rate | Specifies the minimum number of data samples per minute sent to the archiver from all sources. |
| Maximum Event Rate | Specifies the maximum number of data samples per minute sent to the archiver from all sources. |
| Status | The current status of collection. "Running" indicates that the collector is operating. "Stopped" indicates that it is in pause mode and not collecting data. "Unknown" indicates that status information about the collector is unavailable at present, perhaps as a result of a lost connection between collector and server |
| Field | Description |
|---|---|
| Last Sample Timestamp | Displays when the last data sample was written. |
| Redundancy | Indicates whether collector redundancy is enabled or disabled. |
| Machine Name | Displays the machine name where the collector is running. |
| Tag# | Displays the number of tags added to the collector. |