Data Node Panel
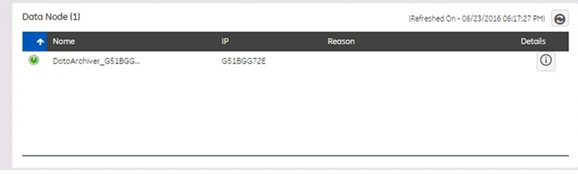
The Data Node panel displays data as described in the following table:
| Field | Description |
|---|---|
| Connection | Indicates the status of the current connection. "Running" (Green) indicates that the Data Archiver is active. "Stopped" (Red) indicates that the Data Archiver is inactive. "Pause" indicates that the user has manually paused it. |
| Name | The logical name of the service. |
| IP | The IP address or the host name of the service. |
| Reason | Displays why the Data Node is not performing as expected. The reason is a warning message for the disk running out of space or memory. To view the details of the problem, move the mouse over the reason. |
| Details | Click this button to view the Data Node Detail Diagnostics. |
Data Node Detail Diagnostics
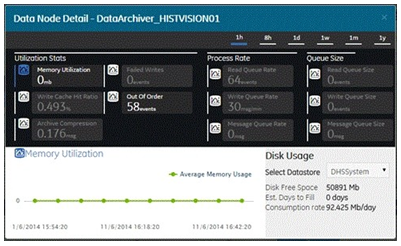
You can choose the time scales by clicking on the time options provided on the top right area of the screen. To graphically view a particular parameter based on the timestamp, click the chart icon of the parameter. Select the Datastore available with the selected data node to view its disk free space and its statistics.
| Field | Description |
|---|---|
| Memory Utilization | Indicates how much server memory is being consumed. |
| Write Cache Hit Ratio | The hit ratio of the write cache in percent of total writes. It is a measure of how efficiently the system is collecting data and should typically range from 95 to 99.99%. If the data is changing rapidly over a wide range, however, the hit percentage drops significantly because current values differ from recently cached values. More regular sampling may increase the hit percentage. Out of order data also reduces the hit ratio. |
| Archive Compression | The current effect of archive data compression. If the value is zero, it indicates that archive compression is either ineffective or turned off. To increase the effect of data compression, increase the value of archive compression deadbands on individual tags in the Tag Maintenance screen to activate compression. In computing the effect of archive compression, Historian counts internal system tags as well as data source tags. Therefore, when working with a very small number of tags and with compression disabled on data source tags, this field may indicate a value other than zero. If you use a realistic number of tags, however, system tags will constitute a very small percentage of total tags and will therefore not cause a significant error in computing the effect of archive compression on the total system. |
| Failed Writes | The number of samples that failed to be written. Since failed writes are a measure of system malfunctions or an indication of offline archive problems, the value shown in the display should be zero. If you observe a non-zero value, investigate the cause of the problem and take corrective action. The Historian also generates a message if a write fails. Note that the message only appears once per tag, for a succession of failed writes associated with that tag. For example, if the number displayed in this field is 20, but they all pertain to one Historian tag, you will only receive one message until the Historian tag is healthy again. |
| Out of Order | The number of samples within a series of timestamped data values normally transmitted in sequence have been received out of sequence since collector startup. This field applies to all collectors. Even though events are still stored, a steadily increasing number of out of order events indicates a problem with data transmission that you should investigate. For example, a steadily increasing number of out of order events when you are using the OPC Collector means that there is an out of order between the OPC Server and the OPC Collector. This may also cause an out of order between the OPC Collector and the data archiver but that is not what this statistic indicates. |
| Field | Description |
|---|---|
| Read Queue Rate | Specifies the number of read requests processed per minute, that came into the archiver from all clients. A read request can return multiple data samples. |
| Write Queue Rate | Specifies the number of write requests processed per minute, that came into the archiver from all clients. A write request can contain multiple data samples. |
| Message Queue Rate | Specifies the number of messages processed per minute. |
| Field | Description |
|---|---|
| Read Queue Size | Displays the total number of messages present in the Read queue. |
| Write Queue Size | Displays the total number of messages present in the Write queue. |
| Message Queue Size | Displays the total number of messages present in the Message queue. |
| Field | Description |
|---|---|
| Disk Free Space | The amount of disk space (in MB) left in the current archive. |
| Est. Days to Fill |
The amount of time left before the archive is full, based on the current consumption rate. At that point, a new archive must be opened (could be automatic). To increase the days to full, you must reduce the Consumption Rate as noted above. To ensure that collection is not interrupted, you should make sure that the Automatically Create Archives option is enabled in the Data Store Maintenance screen (Global Options tab). You may also want to enable Overwrite Old Archives if you have limited disk capacity. Enabling overwrite, however, means that some old data will be lost when new data overwrites the data in the oldest online archive. Use this feature only when necessary. The Estimated Days Until Full field is dynamically calculated by the server and becomes more accurate as an archive gets closer to completion. This number is only an estimate and will vary based on a number of factors, including the current compression effectiveness. The System sends messages notifying you at 5, 3, and 1 days until full. |
| Consumption Rate | The speed at which you are using up archive disk space. If the value is too high, you can reduce it by slowing the poll rate on selected tags or data points or by increasing the filtering on the data (widening the compression deadband to increase compression). |